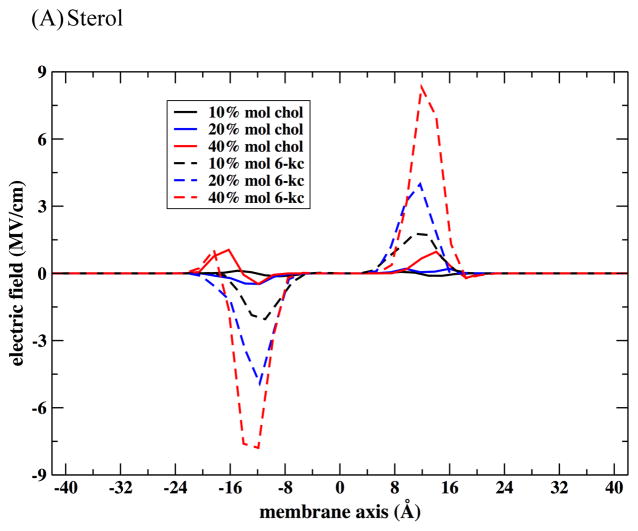
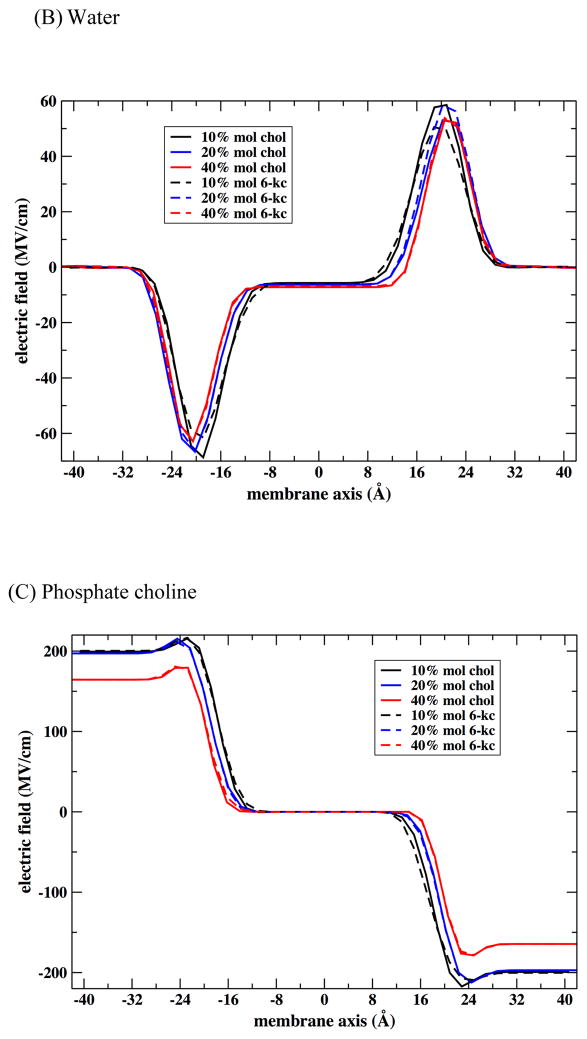
Figure 11.
The contributions of the different membrane components to the electric field across the membrane. Note the different scales of the electric fields at different plots. The dipole moment of the phospholipid shows the largest deviation between the highest concentration of sterol (40%) and the lowest concentration (10%). The water contribution is smaller and has little contributions of the variations between cholesterol and 6-kc. The sterol themselves induce significant variations between their corresponding fields. Note also the exceptionally low electric field at the membrane center.


