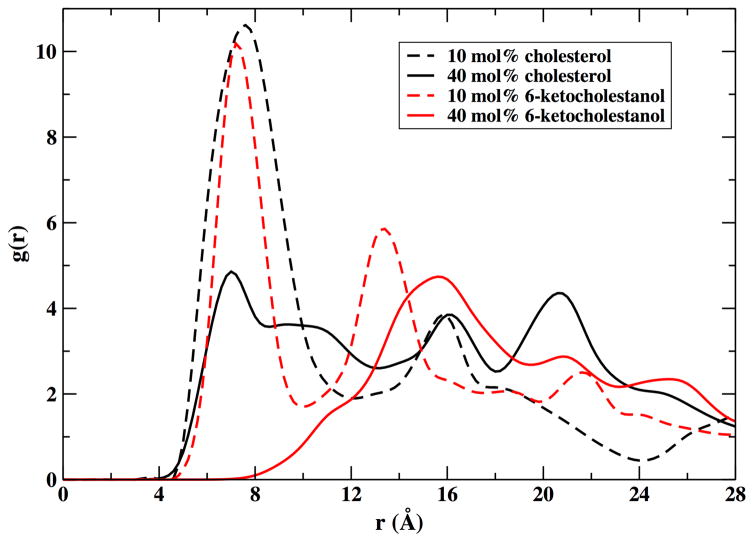
Figure 8.
The three-dimensional radial distribution function, g(r), between the position of the probe in the helix αLAX(16) and cholesterol (black), and αLAX(16) and 6-kc (red) calculated from the MD simulation of sterol-lipid- αLAX(16) containing 10 mol% sterol (dashed lines) and 40 mol% sterol (solid lines).

