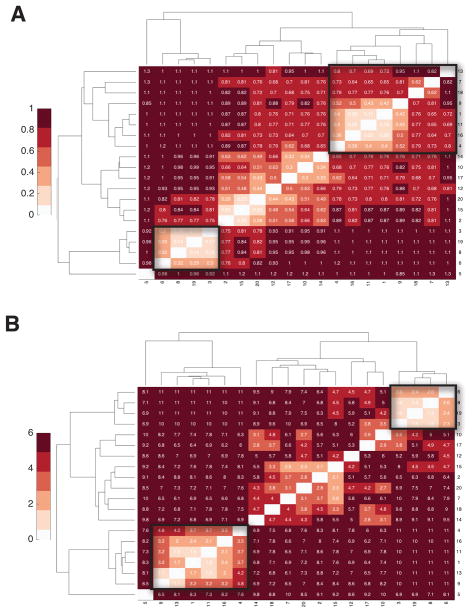
Figure 5.
Comparing clustering analysis of a structural ensemble (TOP7) using different local metrics. (A): Clustering analysis using RMSD as the metric. The nearly correctly folded structures scatter over multiple clusters (inside the black squares). (B): Clustering analysis using the score from CE alignment as the measure. The nearly correctly folded structures again scatter over multiple clusters (inside the black squares).

