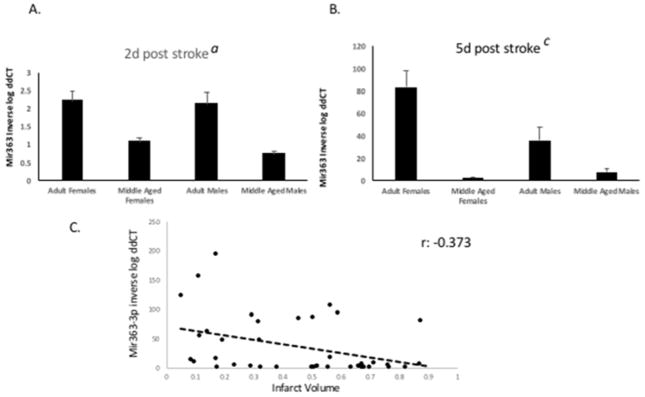
Figure 1. Age and sex differences in circulating mir363-3p expression after stroke.
Mir-363 expression was measured in serum at (A) 2d and (B) 5d post stroke by qRT-PCR. Histogram depicts mean (±SEM) of ddCT values. In all cases, ddCT is normalized to middle-aged females at 2d post stroke. C. Scatterplot representing the relationship between infarct volume and mir363-3p expression at 5d post stroke. Pearsons’s correlation: −.373, p<0.019. a: main effect of age, b: main effect of sex, c: interaction effect. Histograms depict mean±SEM, from 2 separate sets of animals with n=5–6 in each group/set.

