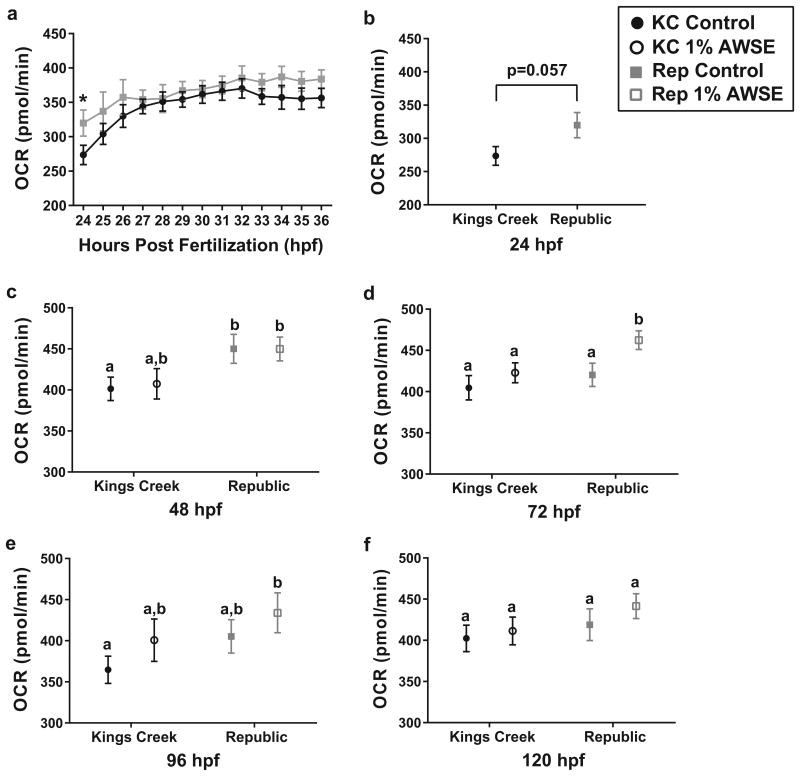
Fig. 5.
Basal OCR of Rep and KC embryos exposed to control conditions (ASW) or 1% (v/v) AWSE during development. Filled black circles represent untreated (ASW control) KC embryos, open black circles represent treated (1% AWSE) KC embryos, closed gray squares represent untreated Rep embryos, and open gray squares represent treated Rep embryos. Error bars represent mean ± SEM. (a) 12-hour time course of basal OCR values from 24-36 hpf. Both time and population were significant factors (p<0.0001 and p<0.002, respectively). Rep groups marked with * are significantly different than KC groups at p<0.05 (2-way ANOVA). (b-e) Measurements of basal OCR in untreated and treated (1% AWSE) Rep and KC embryos at 24, 48, 72, 96, and 120 hpf, respectively. Values marked by different letters are significantly different than each other at p<0.05 (unpaired t-test or 2-way ANOVA)

