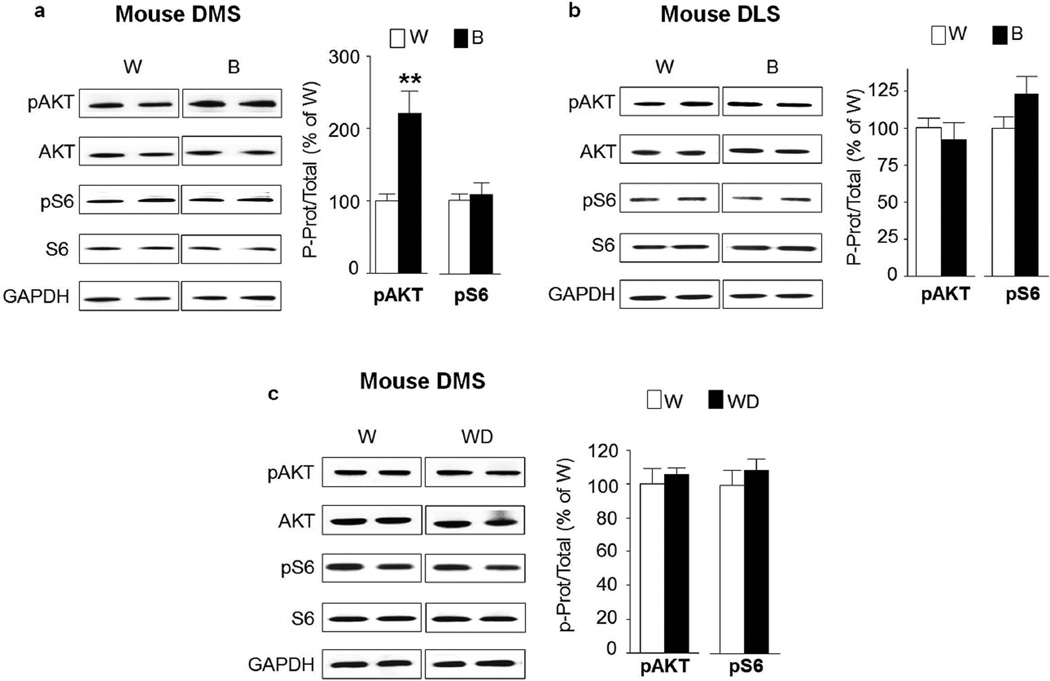
Figure 5. Excessive alcohol intake activates AKT in the mouse dorsomedial but not in the lateral striatum and mTORC1 signaling is not activated in either striatal regions.
After 7–8 weeks of IA20%-2BC, the DMS and DLS of mice were removed 4 hrs after the beginning of the last drinking session (Binge, B, see Fig. 1). Phosphorylation of AKT and S6 was determined by western blot analysis. ImageJ was used for optical density quantification. Data are expressed as the average ratio +/− S.E.M of phospho-AKT to AKT and phospho-S6 to S6 and are expressed as percentage of water (W) controls. Significance was determined using two-tailed unpaired t-test. (a) Phosphorylation level of AKT and S6 in the DMS of alcohol binge drinking mice (B) pAKT p<0.01; pS6 p>0.05. n=11 per group. (b) Phosphorylation level of AKT and S6 in the DLS of binge drinking mice (B) pAKT p>0.05; pS6 p>0.05. n=11 per group. (c) Phosphorylation level of AKT and S6 in the DMS of mice after a 24-hr period of withdrawal (WD) pAKT p>0.05; pS6 p>0.05. n=4 per group.**p<0.01

