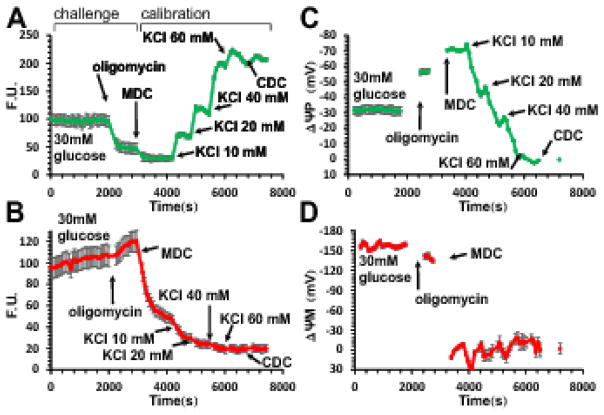
Fig. 1. Determination of absolute values of ΔψP and ΔψM in millivolts in INS-1 832/13 cells from a single time course recording using fluorescence microscopy.
(A–B) Fluorescence time courses of potentiometric probe intensities (F.U., fluorescence units). A, PMPI; B, TMRM. (C–D) Time courses of calibrated potentials corresponding to A–B calculated using parameters given in Error! Reference source not found.. Data are mean±SE of n=12 groups of cells in a single view field, representative of 7 experiments. The calibration algorithm back-calculates ΔψP from KCl-evoked depolarizations, and ΔψM from the decay of TMRM fluorescence upon a sudden and complete mitochondrial depolarization by the mitochondrial depolarization cocktail (MDC) (see Error! Reference source not found.). Both calibrations require fluorescence intensities measured at 0 mV potentials set by the complete depolarization cocktail (CDC). Note that non-quench mode TMRM fluorescence is dependent on both ΔψP and ΔψM, and a fast change in either potential (e.g. subsequent to oligomycin addition) results in a slow redistribution of the probe. The calibration algorithm deconvolutes the observed slow fluorescence change into the instantaneous potentials that cause the redistribution.

