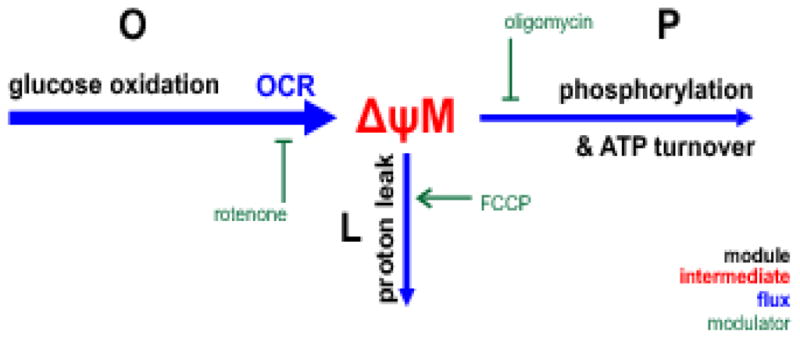
Fig. 3. Modularization of energy metabolism.

Energy metabolism was partitioned into thee modules (black labels): glucose oxidation, O (including glucose uptake, glycolysis, tricarboxylic acid cycle and the respiratory chain), proton leak, L and phosphorylation, P (ATP synthesis and the use of ATP by the cell). These modules share a common intermediate, ΔψM, and there are different fluxes through each (blue arrows; weight indicates the magnitude of the flux). The flux supplying ΔψM is the pumping of protons out of the mitochondrial matrix by the respiratory chain. Since a fixed number of protons is pumped per oxygen consumed, this is measured as mitochondrial oxygen consumption rate of the cells. The protons can reenter the matrix through proton leak or to drive phosphorylation of ADP; the sum of these two fluxes equals the flux of proton pumping. Therefore these fluxes can be expressed as the respiration rate required to drive them. Modulators of each module are shown in green. OCR, oxygen consumption rate.
