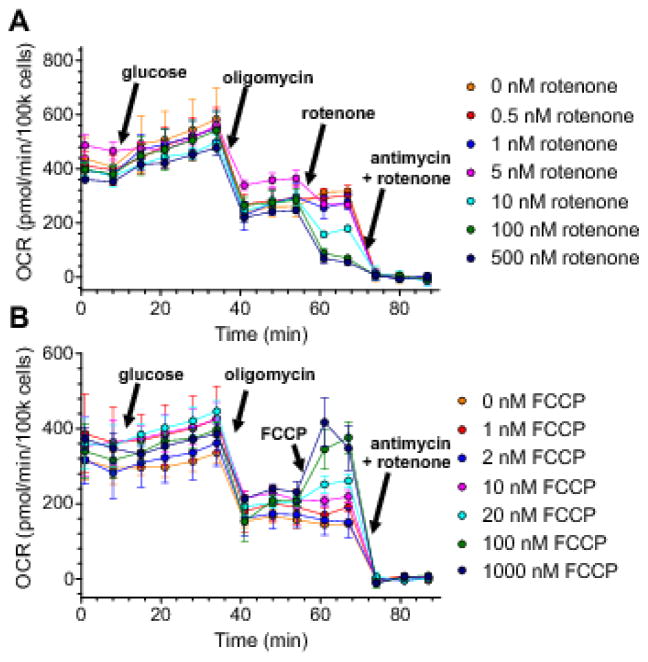
Fig. 5. Measurement of the fluxes through the system for control analysis: rotenone and FCCP titration of respiration of INS-1 832/13 cells.
(A,B) Respiration of INS-1 832/13 cells cultured in identical conditions to Fig. 2 and Fig. 4, but in Seahorse V7 PS flux plates. Additions of glucose (10 mM), oligomycin (2.5 μM) and the indicated concentrations of rotenone (A) or FCCP (B) were followed by rotenone (2 μM) plus antimycin A (2 μM) to determine non-mitochondrial respiration (which was subtracted from all data). Oxygen consumption rate (OCR) is shown normalized to whole-well cell numbers counted after respirometry. Glucose addition served to map the relationship of fluxes through the P+L modules to ΔψM by combining these data with data from Fig. 4. Oligomycin served to inhibit phosphorylation, allowing mapping of the L module by titrating glucose oxidation with rotenone (A) or mapping of the O module by titrating proton leak with FCCP (B). Data are mean±SE of (A) n=9 and (B) n=3 experiments.

