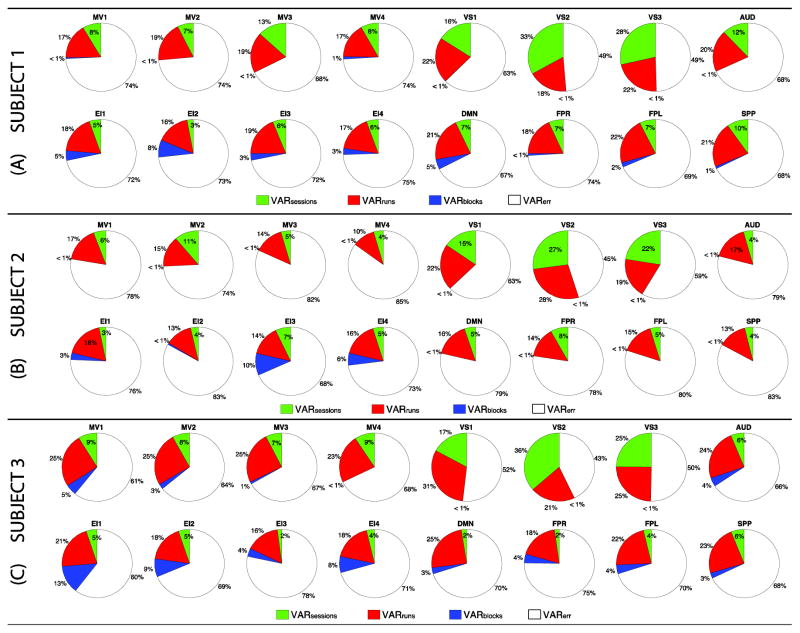
Figure 2.
Pie charts of median per-network contributions of the different variance components to total within-subject variance. (A) Subject 1. (B) Subject 2. (C) Subject 3. In all panels, somatosensory networks are depicted on the top row, and higher-order cognitive networks on the bottom row. When a component contributes less than 1%, a wedge for that component is absent. Color codes: σ2session in green; σ2run in red, σ2block in blue, and σ2err in white.

