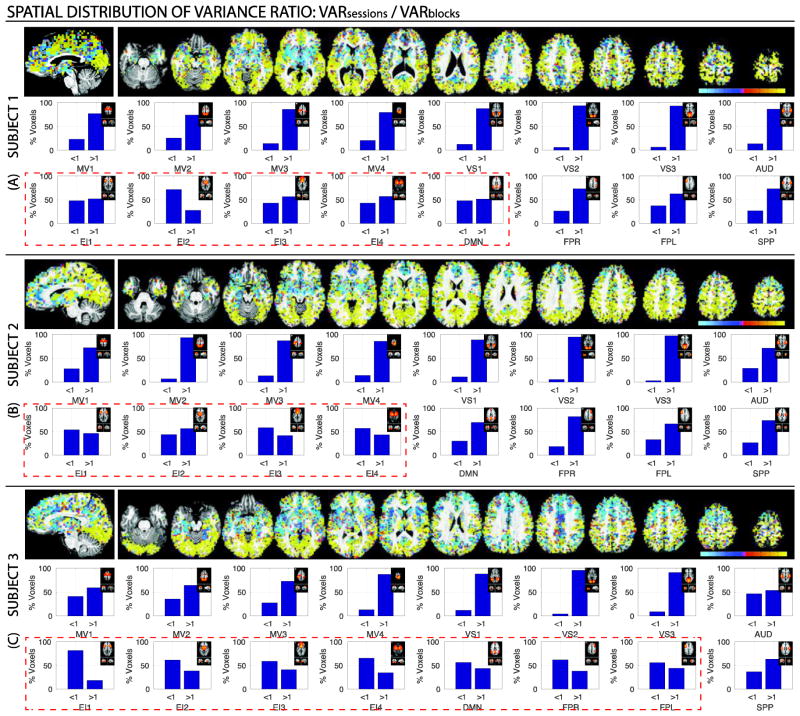
Figure 7.
Maps of voxel-wise ratios for all three subject. (A) Subject 1. (B) Subject 2. (C) Subject 3. For all subjects, on the top we show spatial maps of the voxel-wise ratio of interest. Cold colors signal voxel where , while hot colors signal voxels where . Below the maps, there are 16 bar plots per subject showing the percentage of voxels for which the ratio is greater and lower than one. Each bar plot corresponds to a different network.

