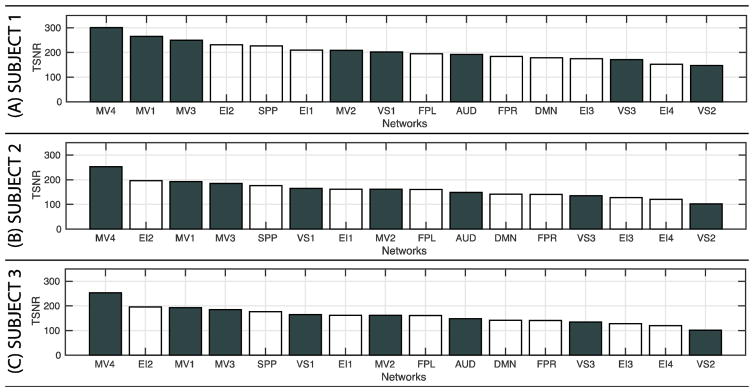
Figure 9.
Average Temporal Signal-to-Noise Ratio (TSNR) for all networks in each of the subjects. (A) Subject 1. (B) Subject 2. (C) Subject 3. For each subject networks are sorted by TSNR in descending order. TSNR for somatosensory networks are depicted as white bars. TSNR for higher-order cognitive networks as dark grey.

