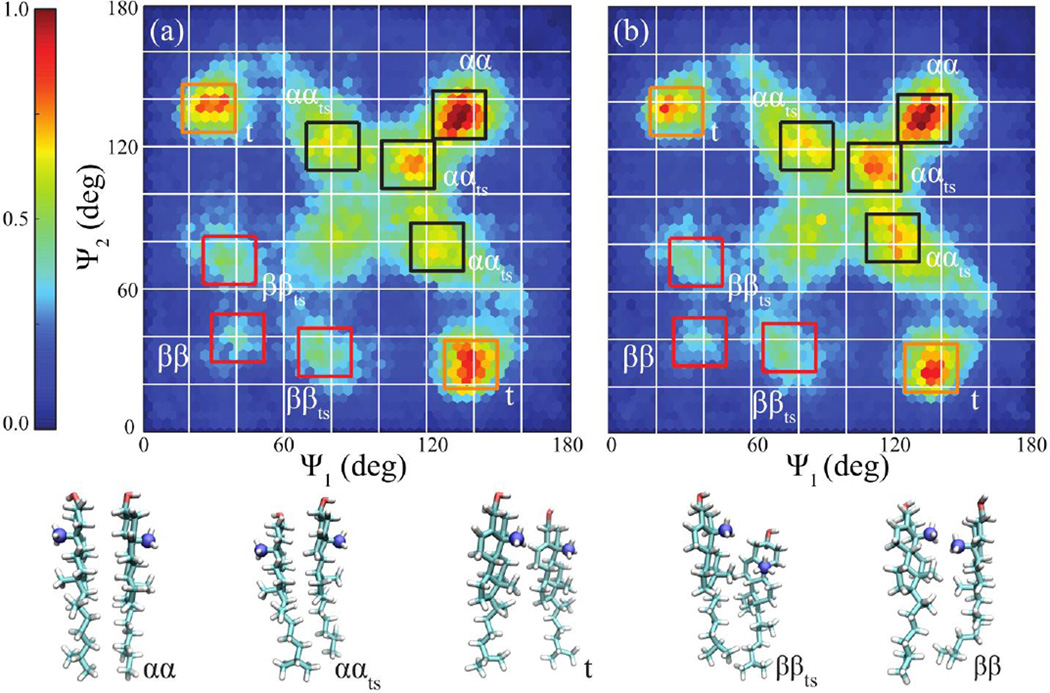
Figure 8.
CHOL dimers projected onto the generalized Crick angle order parameter space (Ψ1, Ψ2) for (a) 20% CHOL and (b) 20% CHOL and 20% SM in POPC bilayers (see Methods, Figure 2). The color map defines the population densities and is scaled to the largest values in (a) and (b), respectively. The lower panel shows characteristic homodimer (αα, ααts, t, ββts and ββ) structures. C19 atoms (blue) identify the beta-face of CHOL. Hexabin density plots are used with grid size of 45.

