Fig. 4.
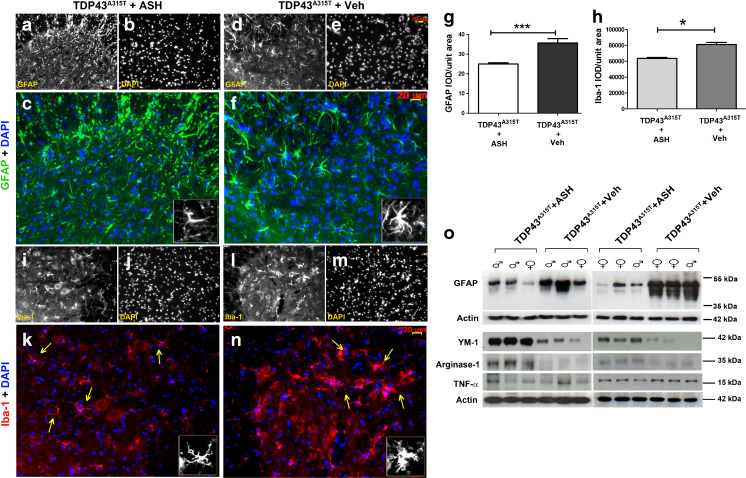
Attenuation of astrogliosis and microgliosis by Ashwagandha (ASH) treatment. Spinal cord sections from ASH- and vehicle (Veh)-treated hTDP-43A315T mice were immunostained for glial fibrillary acidic protein (GFAP; astrocytic marker) or Iba-1 (microglial marker). A marked difference in the phenotype of ASH-treated (a–c) and Veh-treated (d–f) astrocytes were observed. Similarly, microglia also showed decreased activation post-ASH treatment (i–k) as compared with Veh-treated (l–n). All images are of 20× magnification. Scale bar = 20 μm. The single-channel images are in grayscale so as to give better contrast. The merged colored images are 150% enlargements. (Inset) A single cell has been enlarged to 300%. Overall integrated density (IOD) analysis of GFAP (g) and Iba-1(h) staining intensities revealed significant reduction of 28% and 23%, respectively, in the spinal cord of ASH -treated mice. Data are mean ± SEM of multiple sections of at least 3 animals per group. Statistical significance was analyzed by 2-tailed t test with Welch’s correction (*p < 0.05; ***p < 0.001). Western blot analysis also clearly showed more GFAP expression in the spinal cords of Veh-treated mice vs that in ASH-treated mice (o). The expression levels of 2 M2a microglial phenotypic markers (Ym-1 and arginase-1) were found to be increased in the spinal cord of ASH-treated hTDP-43A315T mice when compared with Veh-treated controls. However, the tumor necrosis factor (TNF)-α levels remained the same in the 2 groups (o). DAPI = 4,6-diamidino-2-phenylindole

