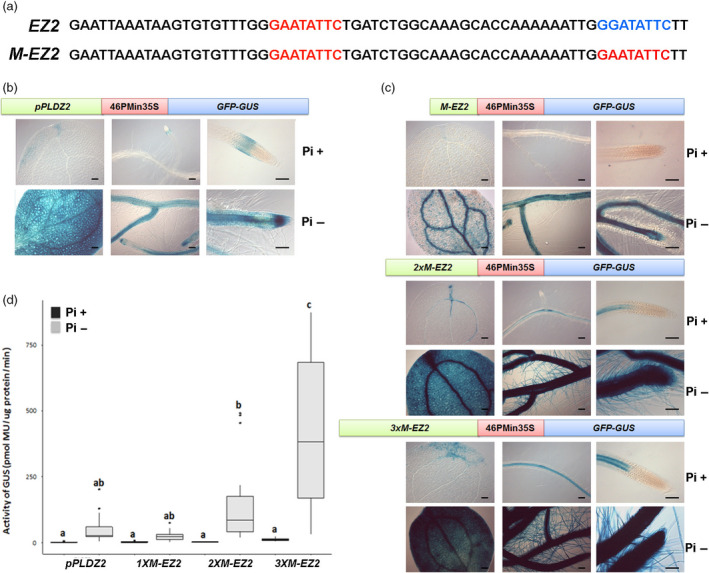
Figure 1.

Structure of EZ2 and M‐EZ2 and level expression of tandem enhancers. (a) The native upstream sequence of the PLDZ2 (locus At3g05630) between position −782 and 717 pb relative to the start codon (top sequence), and the modified sequence containing the duplicated P1BS motif (red) to obtain the M‐EZ2 enhancer (bottom sequence) are shown. (b) Structure and expression of pPLDZ2‐GUS::GFP, Arabidopsis plants carrying the PLDZ2 promoter driving the gene GUS were grown in P+ (1 mm) and P− (0 mm) medium for 10 dag. Plants were stained for GUS activity, and cotyledons, lateral roots and root meristematic region were photographed using Nomarsky optics. (c) Structure and expression of chimeric promoters composed of the sequence of modified enhancer once (1XM‐EZ2), twice (2XM‐EZ2) and three times (3XM‐EZ2) inserted upstream of the −46 S minimal 35S promoter driving the expression of GUS. Seedlings were grown for 10 dag in medium Pi+ (1 mm) or Pi− (0 mm) and stained for GUS activity. Cotyledons, lateral roots and root apical meristems of representative plants from each line and for each condition (Pi+ and P−) were photographed using Nomarsky optics. Bars, 100 μm. (d) Results of the fluorometric assay of eight independent lines for each construction are shown. Values indicate the mean obtained for two biological replicates and four independent technical replicates for each biological sample. Different letters above bars indicate statistically significant differences based on an ANOVA test.
