Figure 3.

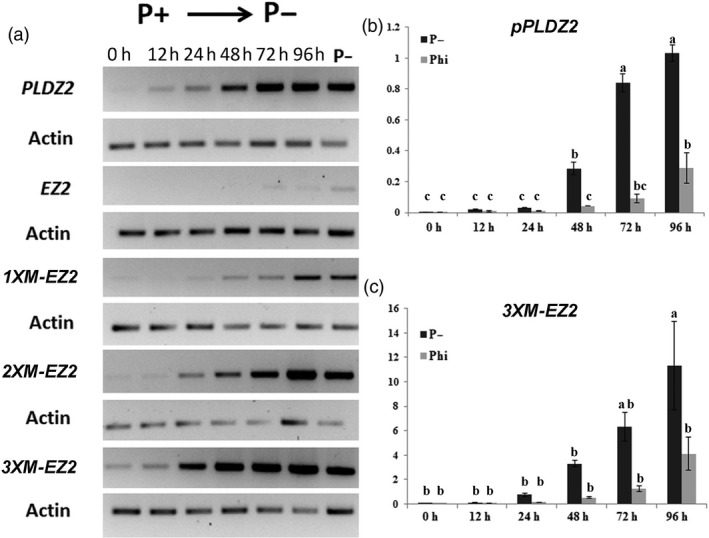
Comparative GUS expression analysis among the native PLDZ2 promoter, EZ2 native and the M‐EZ2 enhancer versions upstream of the −46 S minimal 35 promoter in response to Pi deficiency and Phi supply. (a) Semiquantitative RT‐PCR assays of GUS transcripts driven by either pPLDZ2, EZ2, 1XM‐EZ2, 2XM‐EZ2 or 3XM‐EZ2 were carried out for plants grown for 7 dag in P+ (1 mm) and transferred to P− (0 mm) medium for 12 h, 24 h, 48 h, 72 h and 96 h. Transcript levels for plants grown continuously in P− are also indicated. (b) Quantitative reverse transcription PCR analysis for GUS expression of plants carrying pPLDZ2‐GUS::GFP and (c) 3XM‐EZ2‐GUS::GFP, grown in P+ (1 mm) for 7dag and transferred to P− (0 mm) or phosphite (Phi, 1 mm) are shown. A time course indicating the transcript level of the reporter gene is shown. Values are reported as a relative quantification [2(−∆ Cт)] between the reporter gene and the ACTIN2 gene for each condition. Data are the mean of two biological replicas, and letters above bars indicate statistically significant differences supported by ANOVA test.
