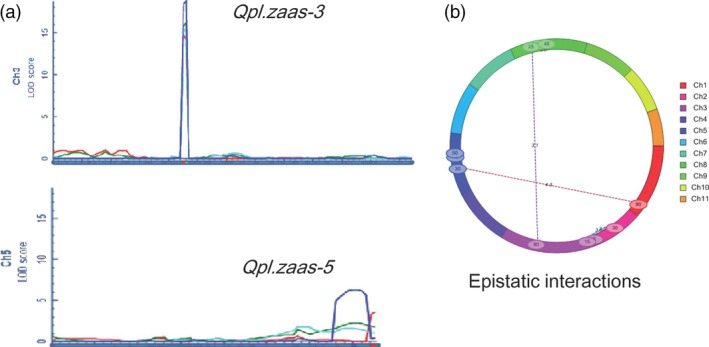
Figure 2.

QTLs detected under the additive (a) and epistatic interaction (b) models implemented in QTL iCIMapping software. In (a), different colours represent results obtained from different trials. Dark blue: 2009HN; Red: 2010HN; Green: 2010SX; Light blue: 2009SX. Number of RILs for mapping = 119.
