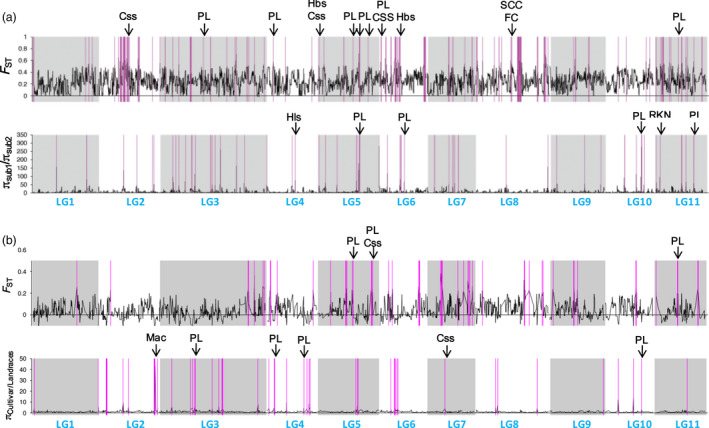
Figure 5.

Genome scan for F ST and π ratio. For (a), the parameters were calculated between the two subgene pools and for (b) between the cultivars/breeding lines and landraces of subpopulation 2. Both parameters were first calculated at each SNP site and then were averaged and plotted via a kernel‐smoothing moving method that took 0.15 cM sliding windows with 0.03 cM steps to generate genome‐wide distributions. A bootstrap resampling technique was applied for assigning significance threshold values. One million replicates were run for each statistic. Putative selective signal regions (outliers of F ST and π ratio, P ≤ 0.05) are highlighted in purple. Qualitative genes/QTLs overlapping with the selective signals are marked with black arrows. PL: pod length; Hbs: heat‐induced brown discoloration of seed coats; RKN: resistance to root‐knot nematodes; SSC: seed coat colour; FC: flower colour; Css: seed size; Hls: hastate leaf shape; Mac: resistance to Macrophomina phaseolina.
