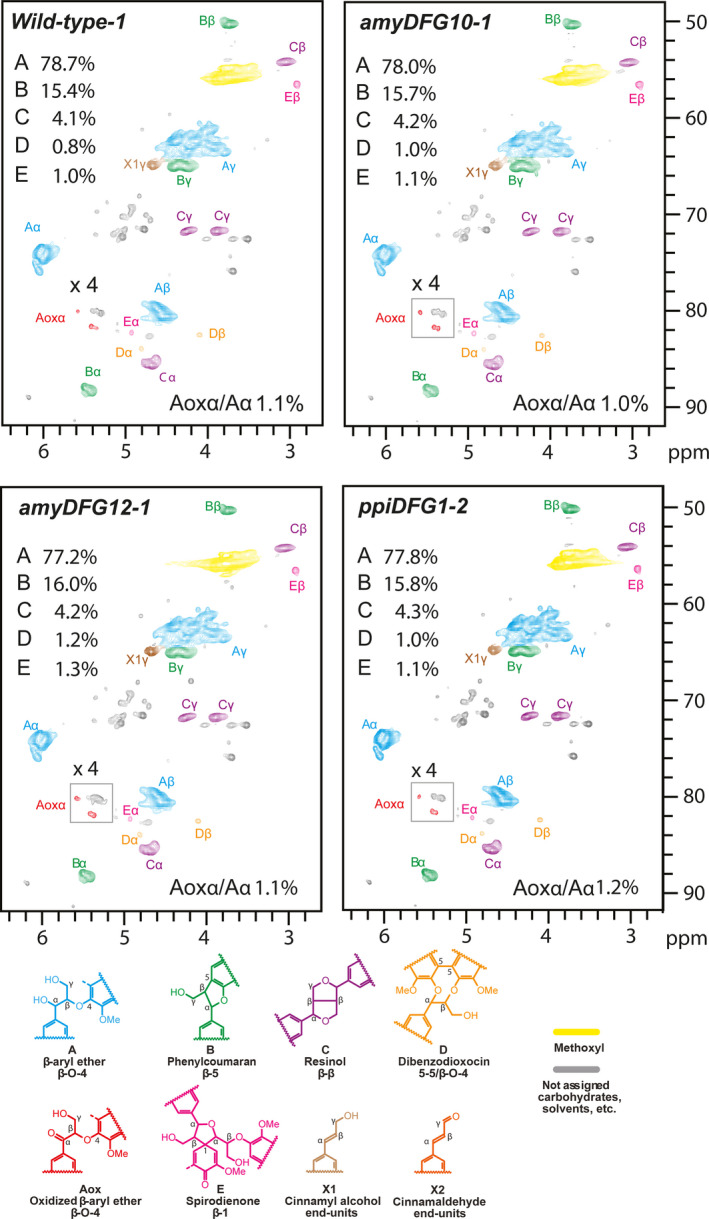
Figure 5.

Aliphatic region of partial 2D HSQC NMR spectra obtained by analysis of three biological replicates of the LigDFG lines and wild type. A single representative spectrum from each line is shown. The content of particular units is the average of the three replicates. See Table S3 for details.
