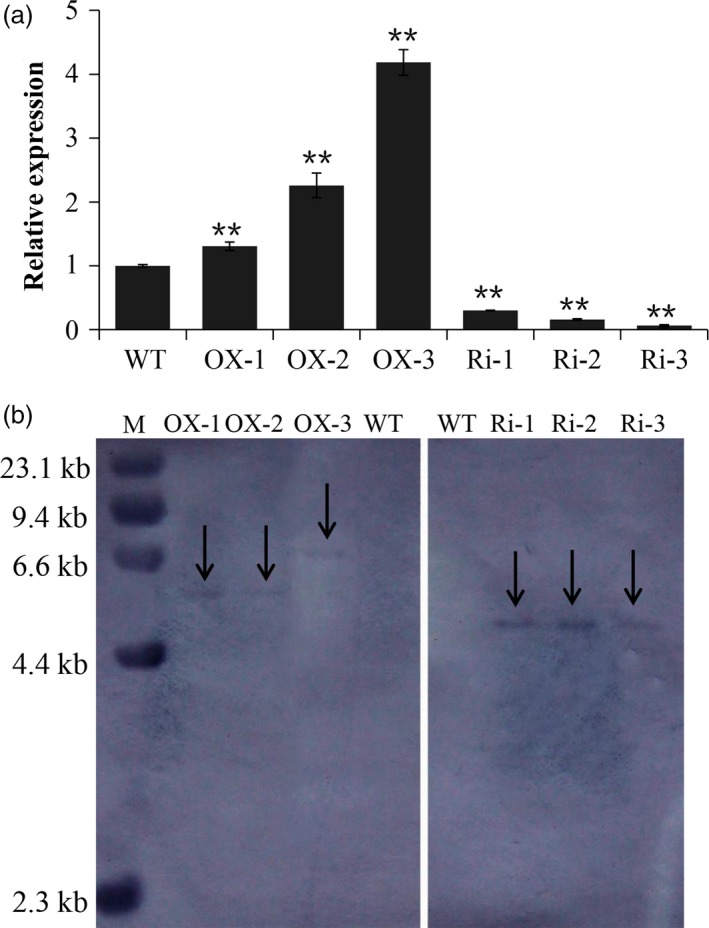
Figure 3.

Analysis of WT and the transgenic lines. Real‐time quantitative RT‐PCR was used for analysis of RAG2 transcription in transgenic rice (a), and 10 μg of genomic DNA from each plant line was digested with HindIII for DNA blot hybridization (b). Data are mean ± SE for three replicates. *P < 0.05, **P < 0.01. P‐values produced by two‐tailed Student's t‐test.
