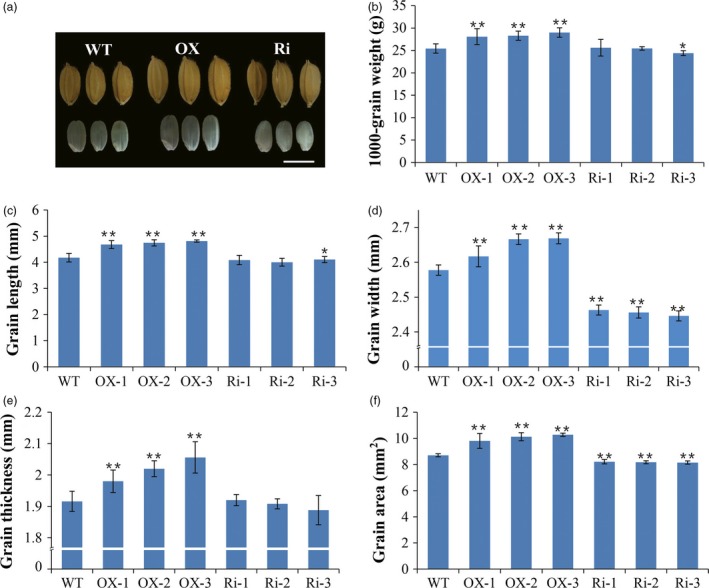
Figure 4.

Phenotypes of grain yields of WT and the transgenic lines. (a) Grain size comparison among the RAG2‐OX,RAG2‐RNAi and WT seeds. (b) 1000‐grain weights of the RAG2‐OX,RAG2‐RNAi and WT seeds. (c) Grain lengths of the RAG2‐OX,RAG2‐RNAi and WT seeds. (d) Grain widths of the RAG2‐OX,RAG2‐RNAi and WT seeds. (e) Grain thicknesses of RAG2‐OX,RAG2‐RNAi and WT seeds. (f) Grain areas of the RAG2‐OX,RAG2‐RNAi and WT seeds. Scale bars (a) 5 cm. Values in (b–f) are means ± SD (n = 20). Two‐tailed Student's t‐tests were performed between the RAG2‐OX and WT, and RAG2‐RNAi and WT, respectively (*P < 0.05, **P < 0.01).
