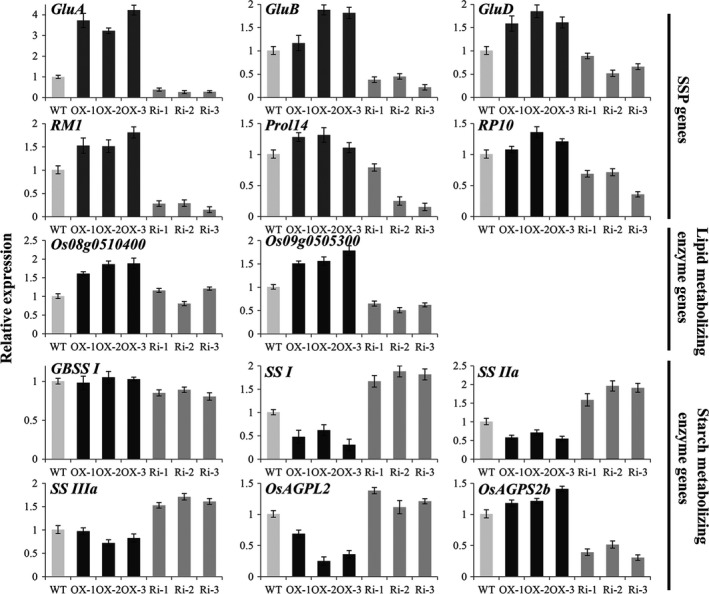
Figure 8.

Expression analyses of SSP genes and starch and lipid‐metabolizing enzyme genes by quantitative RT‐PCR. RNA was extracted from developing seeds at 14 d after flowering (DAF) for SSP genes (GluA, GluB, GluD,RM1, Prol14 and RP10) and lipid (Os08g0510400 and Os09g0505300) and starch (GBSS I,SS I,SS IIa,SS IIIa, OsAGPL2 and OsAGPS2b)‐metabolizing enzyme genes. Light‐grey, black and dark‐grey bars represent the expression levels in WT,RAG2‐OX and RAG2‐RNAi line seeds, respectively. The relative expression levels were normalized to those of UBI.
