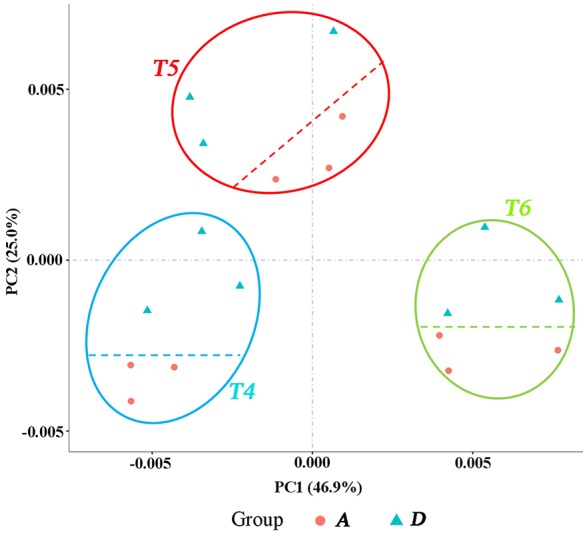
Figure 3.

PCA displaying the intrinsic biological variation among samples. Group A: samples from block A. Group D: samples from Block D. The three trilaterals or roundness in each ellipse represents three biological replicates at the same time point (development stage).
