Figure 3.
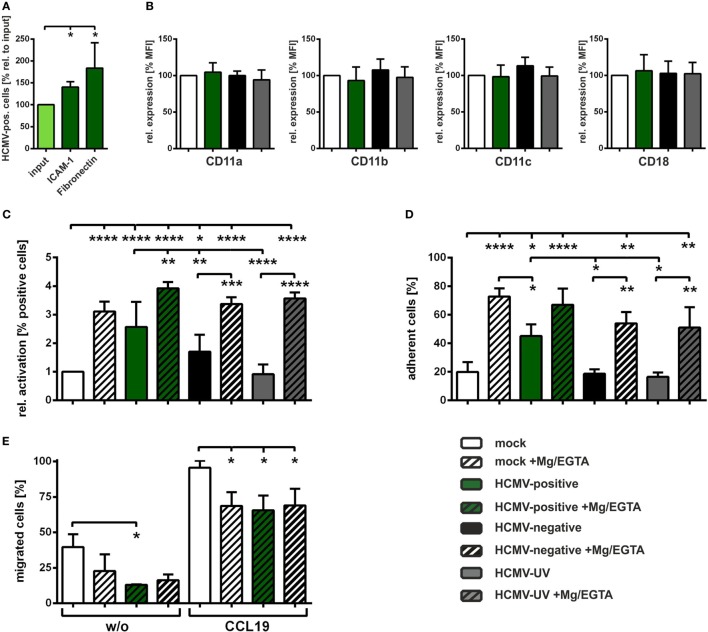
Human cytomegalovirus (HCMV) increases activation of β2-integrins thereby inducing mature DCs (mDCs) adhesion and reducing mDC transwell migration. (A) Mature dendritic cells (DCs) were HCMV-infected and subjected to ICAM-1 or fibronectin adhesion assays 24 hpi. Infection rates were determined before adhesion (input condition, light green bar) and after ICAM-1 (n = 5) or fibronectin (n = 3) adhesion (green bars). Infection rate before adhesion (input) was set to 100% and relative changes of infection rates in the adherent fractions are shown. (B) Mock-, HCMV-, or HCMV-ultraviolet (UV)-infected mDCs were harvested 24 hpi, stained with antibodies specific for CD11a/b/c or CD18 and analyzed via flow cytometry. Uninfected mock cells (white bar) were set to 100% and relative expression as mean fluorescence intensity for HCMV-positive (green bars), HCMV-negative (black bars), and HCMV-UV-infected (gray bars) mDCs are shown (n = 3). (C) Mock-, HCMV-, or HCMV-UV-infected mDCs were harvested 24 hpi and treated with (striped bars) or without Mg/EGTA (filled bars). Subsequently, cells were stained with an antibody specific for an epitope specifically present on activated CD11/CD18 (β2) integrins and subjected to flow cytometric analyses. Mock (white bar) was set to “1,” and relative activation is shown for the indicated conditions. The experiment was performed at least three times with cells of different healthy donors. (D) Mature DCs were infected and treated with (striped bars) or without Mg/EGTA (filled bars) as described in (C) and subjected to fibronectin adhesion assay. Percentages of adherent cells are depicted for each condition (n = 3). (E) Mock- or HCMV-infected mDCs (24 hpi) were treated with Mg/EGTA (striped bars) and subjected to transwell migration assays. For induction of chemotaxis, CCL19 (100 ng/ml) was added to the lower wells, while spontaneous migration without chemokine was analyzed as control (w/o). Migration was evaluated after 2 h. The percentages of migrated mDCs were calculated in the lower well by determining cell number and infection rates of migrated cells in relation to the respective starting condition. Untreated mock cells are depicted as control (white bars). The experiment was performed with cells of three different healthy donors. Only significant changes (**** = p < 0.0001; *** = p < 0.001; ** = p < 0.01; * = p < 0.05) are marked by asterisks.

