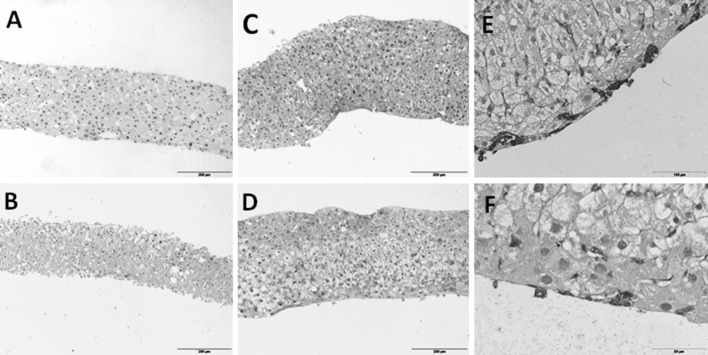
Fig. 2.
Hematoxylin–eosin staining of cross sections of hPCLS at 0 h (a) and incubated 120 h in WME (b), RegeneMed® (c) or Cellartis® (d). Vimentin staining of the new cell layer around the slice incubated for 120 h in RegeneMed® (e) or Cellartis® (f). Representative images are shown. Scale bar 200 µm for a–d, 100 µm for e and 50 µm for f

