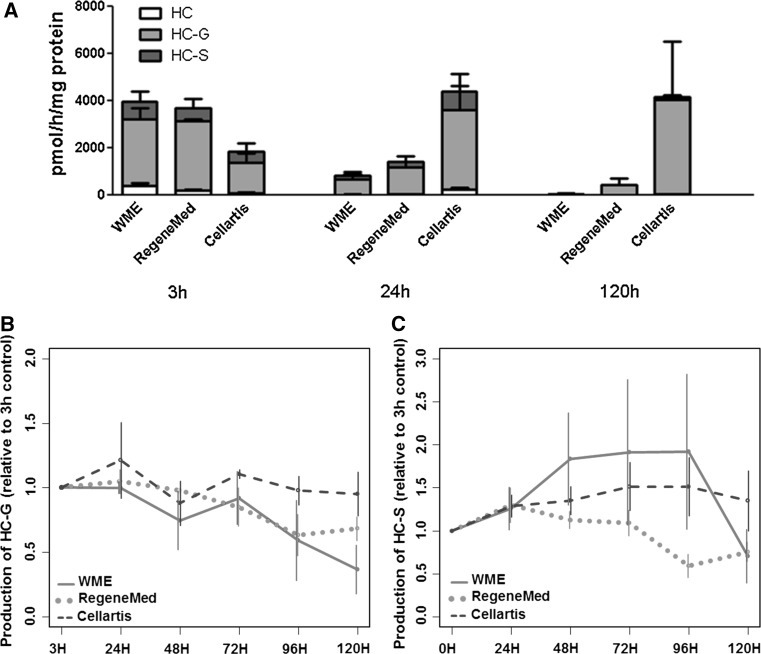
Fig. 5.
Phase I and II metabolism of 7-EC (a) and Phase II metabolism of 7-HC (b, c) during 5 days by hPCLS incubated in WME (red line), RegeneMed® (green dotted line), and Cellartis® (blue dashed line). Data are expressed as relative values (±SEM) to the value at 0–3 h incubation (color figure online)

