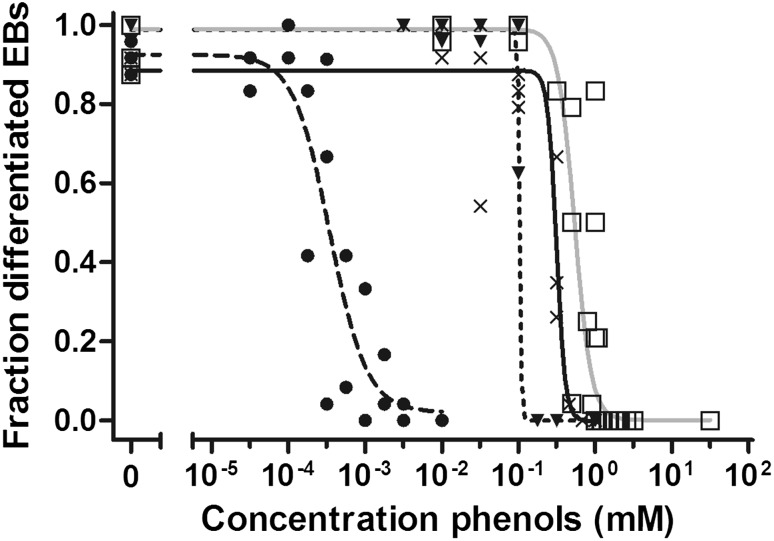
Fig. 2.
Concentration–response curves for phenol (grey line, open square), p-fluorophenol (solid line, cross symbol), p-heptyloxyphenol (dashed line, filled circle) and p-methylketophenol (dotted line, filled down pointing triangle) representing the inhibition of differentiation of the embryoid bodies (EBs) by the compound. Data obtained from Strikwold et al. (2012)

