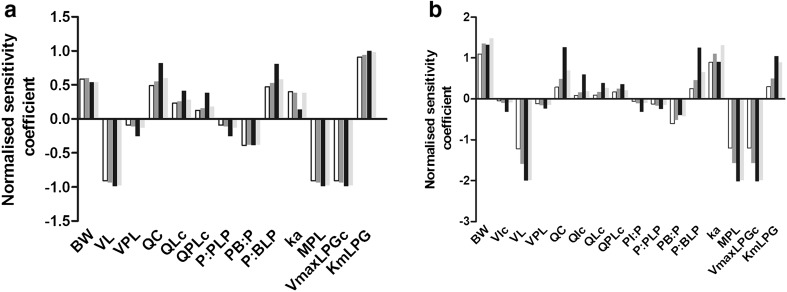
Fig. 4.
Normalised sensitivity coefficients for parameters of the PBK model for phenol (white bars), p-fluorophenol (dark grey bars), p-heptyloxyphenol (black bars) and p-methylketophenol (light grey bars) based on foetal C max values from a single oral dose of 2.0 mg/kg bw (a) and 200 mg/kg bw (b). Normalised sensitivity coefficients ≥0.2 are presented. BW body weight, VIc fraction intestinal tissue, VL fraction liver tissue, VPL volume placental tissue, QC cardiac output, QIc fraction intestinal flow, QLc fractional liver flow, QPLc fractional placental flow, PI:P partition coefficient intestine:plasma, PPL:P partition coefficient placenta:plasma, PB:P partition coefficient body remaining:plasma, PBL:P partition coefficient blood:plasma, ka oral absorption coefficient, MPL liver microsomal protein yield, VmaxLPGc unscaled maximum rate of glucuronidation of phenols in liver, KmLPG Michaelis–Menten constant for glucuronidation of phenols in liver

