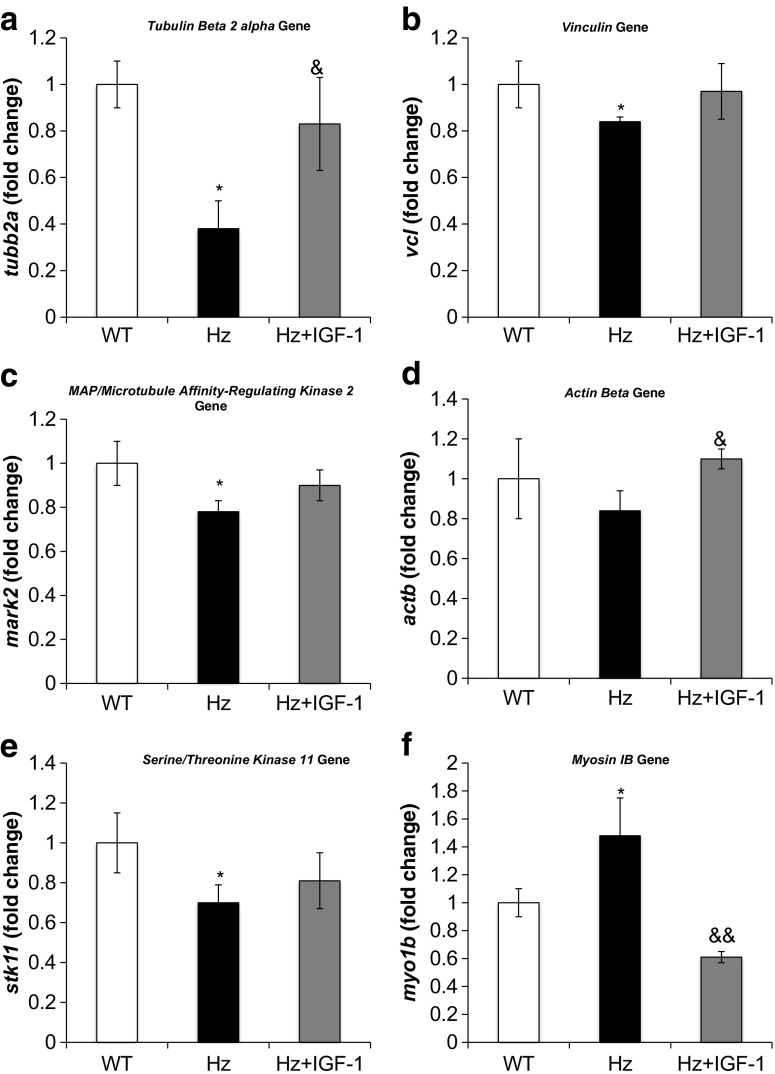
Fig. 6.
Real-time qPCR genetic expression analysis of proteins involved in the cytoskeleton: a tubulin beta 2 Alpha (tubb2a), b vinculin (vcl), c MAP/microtubule affinity-regulating kinase 2 (mark2), d actin beta (actb), e serine/threonine kinase 11 (stk11), and f myosin 1 beta (myo1b) from liver homogenate in the three experimental groups. *p < 0.05, **p < 0.01 Hz group vs. controls (WT); & p < 0.05, && p < 0.01 Hz + IGF-1 group vs. untreated Hz group (Hz); in all cases, no statistical difference between Hz + IGF-1 and control groups

