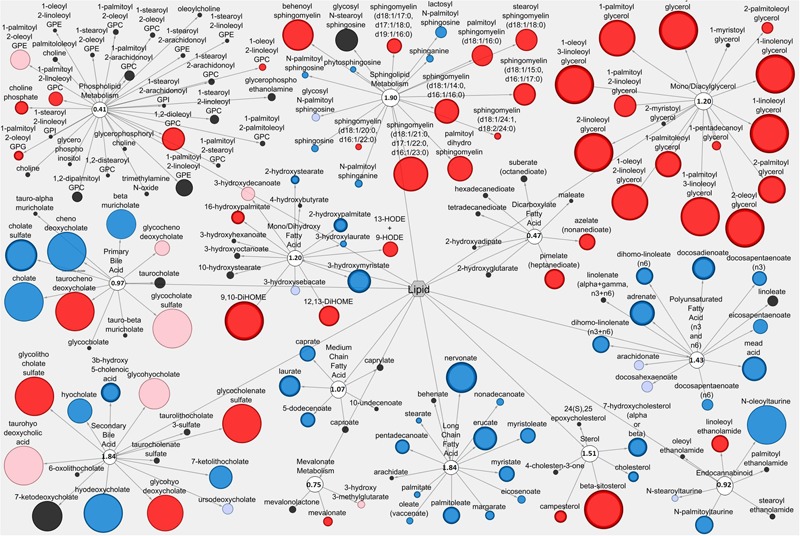
FIGURE 3.

Cytoscape network analysis of select lipid pathways in the large intestinal contents when comparing Probiotic + Rice Bran and Probiotic. Cytoscape visualization of lipid metabolites in LIC metabolic pathways associated with anti-diarrheal activity across Pro+RB and Pro. For each metabolite, node diameter is proportional to the magnitude of the fold difference in Pro+RB compared to Pro. Node color indicates the direction of a metabolite’s fold difference: red indicates metabolites with a higher scaled abundance in Pro+RB (p < 0.05), blue indicates lower abundance in Pro+RB (p < 0.05), pink indicates trending higher in Pro+RB (0.05 < p < 0.10), and light blue indicates trending lower in Pro+RB (0.05 < p < 0.10). Black nodes indicate metabolites with fold differences that were not significantly altered between treatments. The pathway enrichment score is the number in the circle for each pathway.
