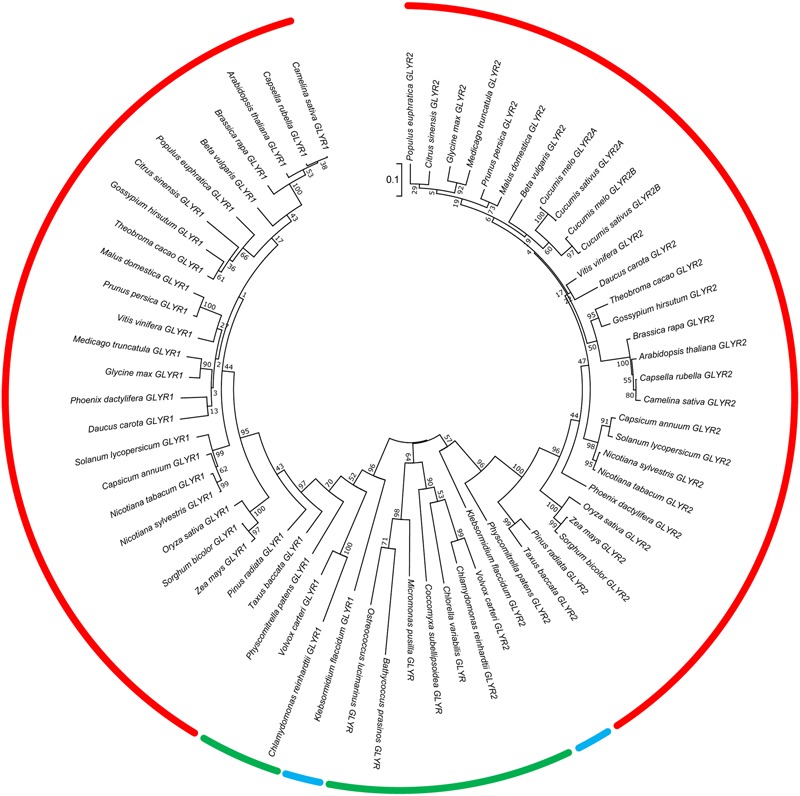
FIGURE 1.

Phylogenetic analysis of plant GLYR amino acid sequences across plant species. The unrooted phylogenetic tree was depicted using the Maximum Likelihood method in MEGA7. The red, blue, and green bars represent species in the Embryophyta, Charophyta, and Chlorophyta, respectively. The numbers at each node represent support values obtained by a bootstrap test using 1000 replicates (Felsenstein, 1985). The tree is drawn to scale (0.1 representing a 10% change) with branch lengths in the same units as those of the evolutionary distances used to infer the phylogenetic tree. The protein IDs for the GLYR1s and GLYR2s are given in Supplementary Tables S1, S2.
