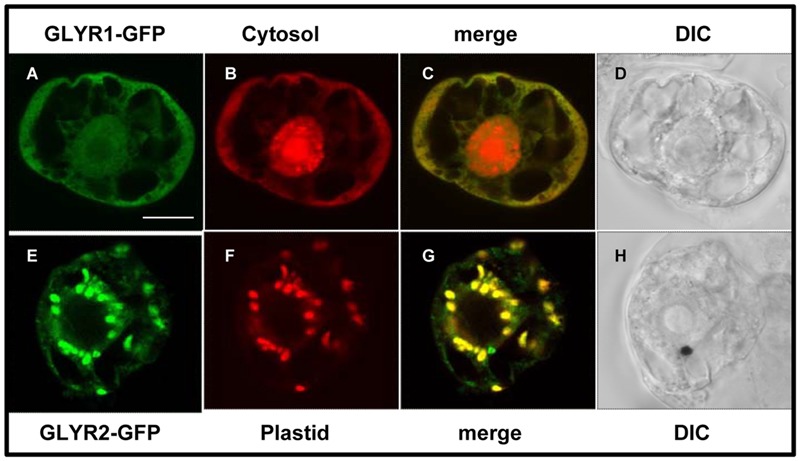
FIGURE 2.

Subcellular localization of MdGLYRs in tobacco BY-2 cells. Representative CLSM images of BY-2 cells (co)expressing (as indicated by the panel labels) MdGLYR1-GFP (A) and the cytosolic marker Cherry (B) or MdGLYR2-GFP (E) and plastid marker PDCpl-E2-mCherry (F). Processing of cells and viewing using CLSM are described in the Section ‘Materials and Methods’. Shown also is the corresponding merged (C,G) and differential inference contrast (DIC) (D,H) images for each cell. The yellow color in the merged images indicates co-localization. Scale bar in A = 10 μm.
