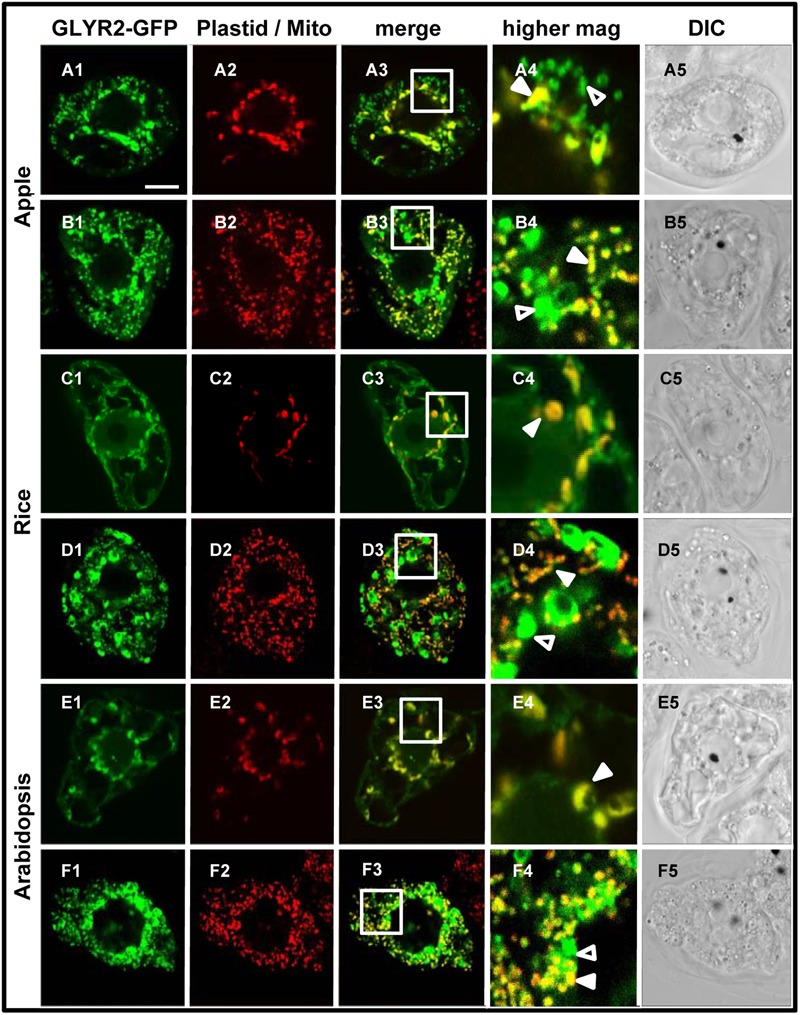
FIGURE 3.

Plastid and mitochondrial localization of MdGLYR2, AtGLYR2, or OsGLYR2 in tobacco BY-2 cells. (A–F) Representative CLSM images of BY-2 cells (co)expressing (as indicated by the panel labels) MdGLYR2-GFP, OsGLYR2-GFP, or AtGLYR2-GFP and either the plastid marker PDCpl-E2-Cherry or immunostained for endogenous, mitochondrial CoxII. Processing of cells for immunofluorescence and viewing using CLSM are described in the ‘Materials and Methods’. Shown also is the corresponding merged and DIC images for each cell. Boxes in the merged images represent the portion of the cell shown at higher magnification in the panel to the right. The yellow color in the merged images indicates co-localization; solid arrowheads indicate obvious examples of co-localization, whereas open arrowheads indicate obvious examples of non-co-localization. Scale bar in A = 10 μm.
