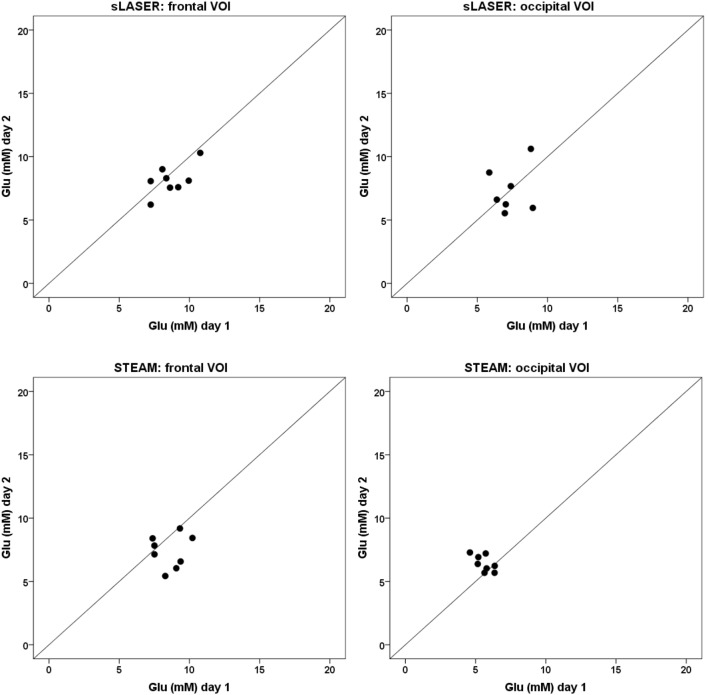
Figure 3.
Glutamate concentrations calculated with an 8-metabolite fit at day 1 (x-axis) and day 2 (y-axis). The line x = y represents a correlation of +1 between the two measurements. A point-spread along the line x = y represents detection of mainly physiological variation, a point-spread perpendicular to the line x = y represents detection of mainly methodological variation.

