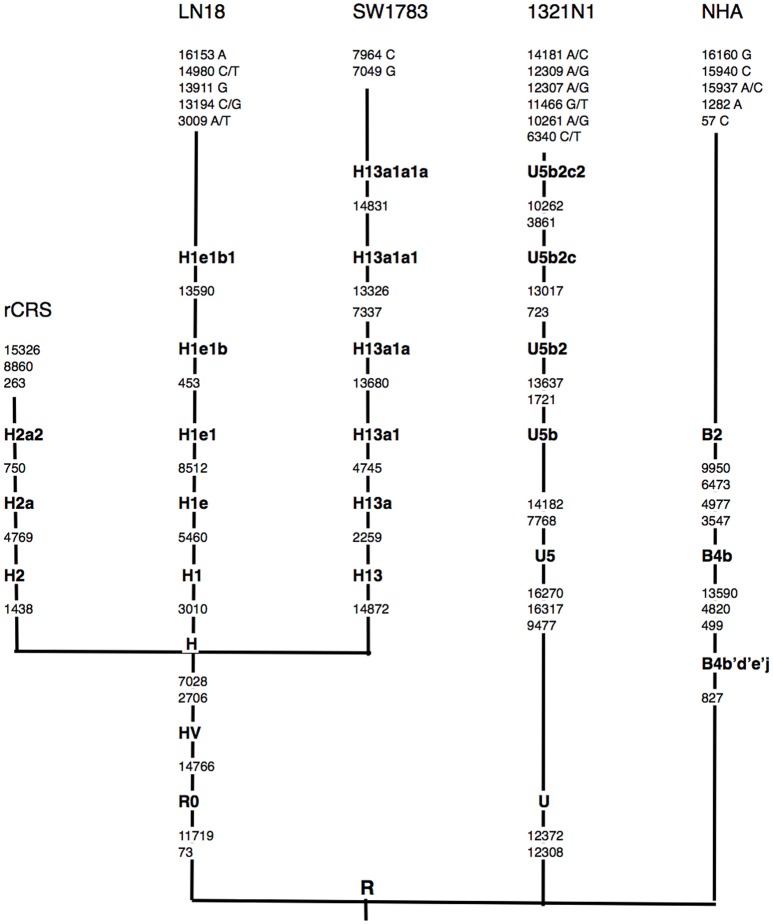
Figure 1.
Schematic representation of mtDNA sequence phylogenetic tree. mtDNA sequence phylogenetic tree constructed from all 3 different grades of glioma, normal human astrocyte (NHA) cell lines and the revised Cambridge reference sequence (rCRS) [NC_012920]. Suffixes indicate transitions, “/” indicates heteroplasmy changes. Word in bold along the lineage line represent haplogroup names. Nucleotide changes after the most distal haplogroup assignment were considered as non-lineage specific, likely somatic sequence alterations.

