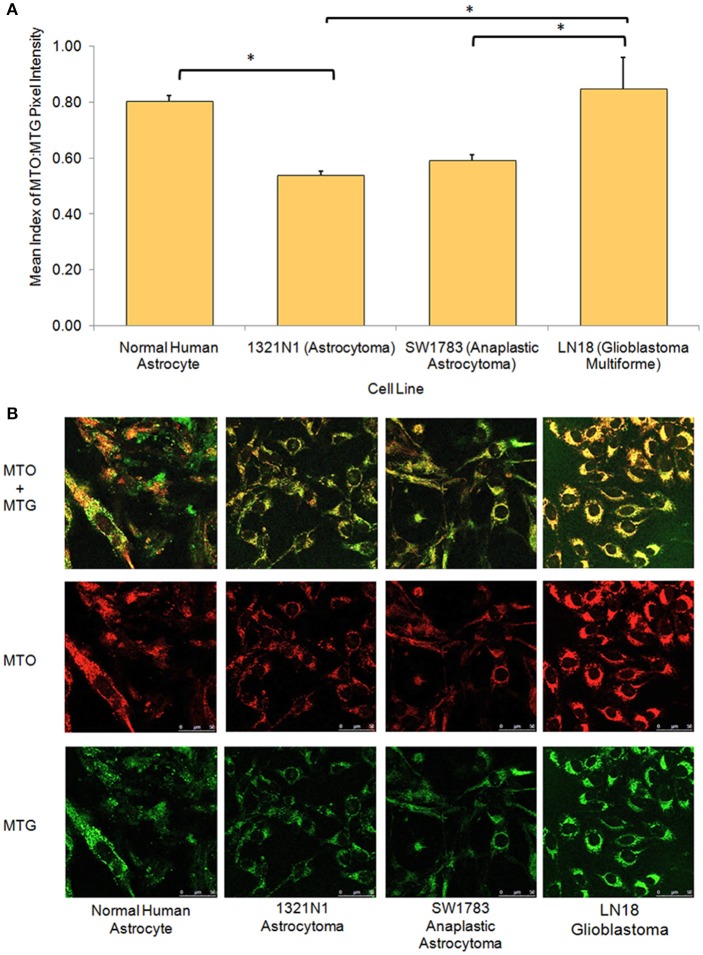
Figure 3.
Relative mitochondrial functions in different grades of glioma cell lines and normal human astrocyte. (A) Bar chart showing significantly lower level of mitochondrial function:mass ratio in grade II 1321N1 and grade III SW1783 cell line (*indicates p < 0.05 using one-way ANOVA, bars represent mean MTO:MTG pixel intensity index ± 1 SEM, mean index value as shown in bars). (B) Relative mitochondrial functions were demonstrated using MitoTracker Orange (MTO) stain where relative mitochondrial mass was shown by MitoTracker Green (MTG) stain. Each stain was captured using CLSM with sequential detection. Images merged and analyzed quantitatively using LAS AF software to generate the relative function ratio.

