
FIGURE 2.
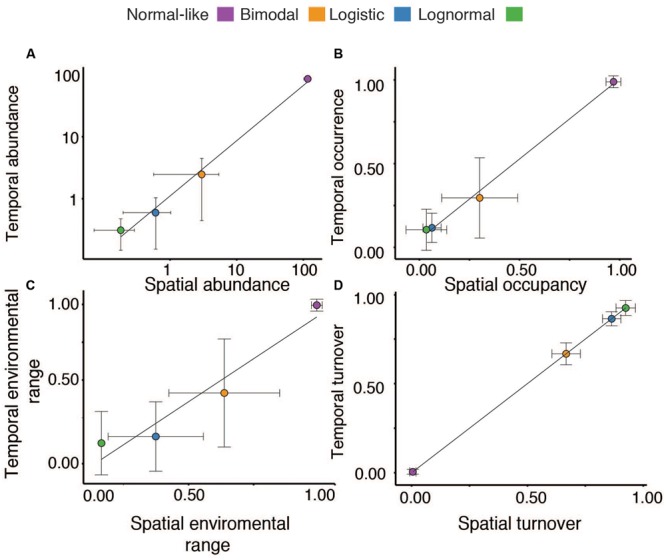
Relationship between the average temporal (Y-axis) and spatial (X-axis) mean abundances (A), temporal occurrence and spatial occupancy (B), environmental ranges (estimated based on temperature in the case of Croche and pH in the spatial study, see Materials and Methods) (C), and OTU temporal and spatial turnover (D) for the different normal-like, bimodal, logistic, and lognormal (green) categories. The dots represent the mean and the error bars the standard deviation associated to each mean.