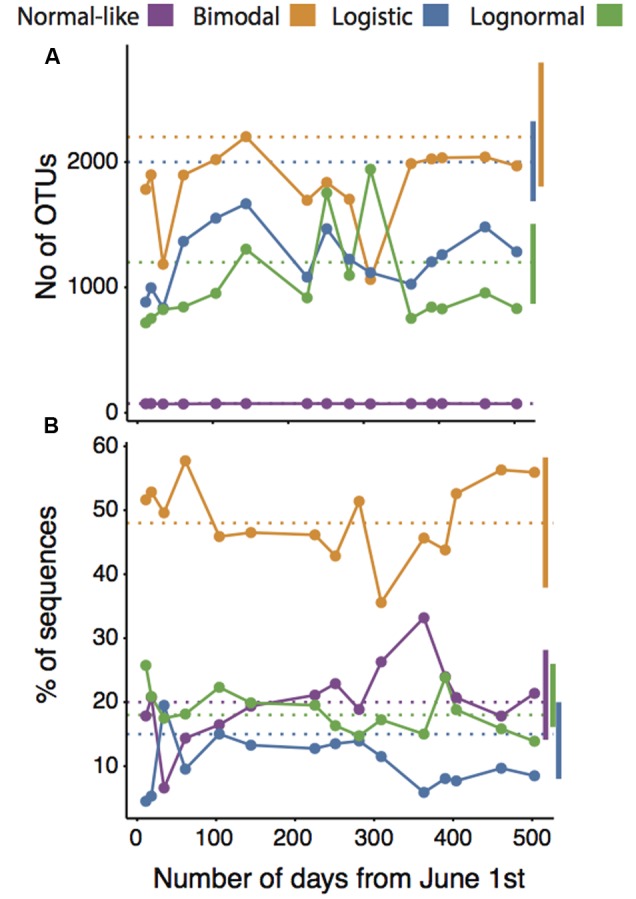
FIGURE 3.

Temporal patterns in the number of OTUs (A) and the percentage of sequences (B) associated to normal-like, bimodal, logistic, and lognormal categories along the annual cycle in lake Croche, in relation to their respective means (dotted horizontal lines) and ranges of variation (vertical bars) derived from the large-scale spatial dataset (198 lakes).
