FIGURE 1.

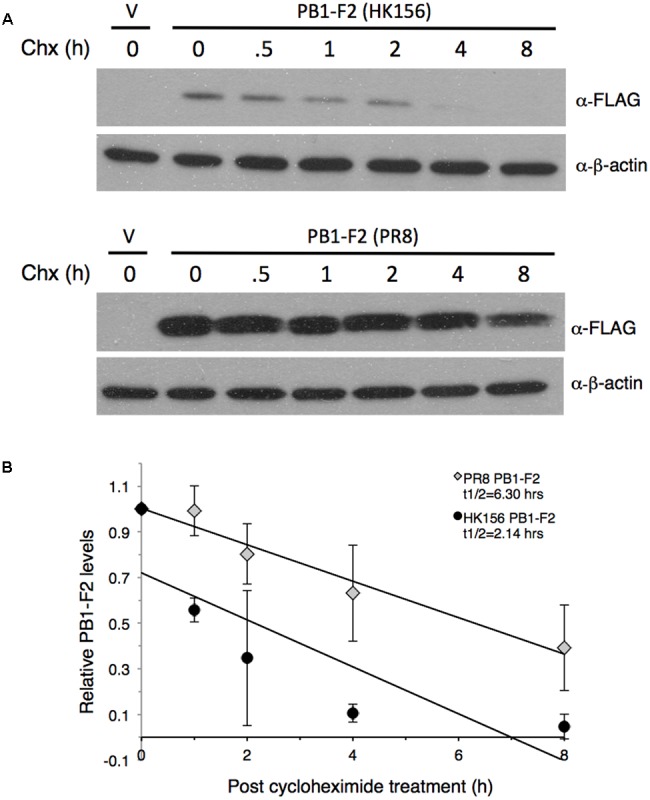
Measurement of PB1-F2 half-life. Plasmids expressing FLAG-PB1-F2 (HK156) and FLAG-PB1-F2 (PR8) were transfected into HEK293T cells for 16 h before cycloheximide was added. Cells were harvested at 0, 0.5, 1, 2, 4, and 8 h post-cycloheximide treatment for Western analysis using anti-FLAG antibody. Additional three sets of experiments were performed without 0.5 h time point. (A) Representative blots for PB1-F2 (HK156) (Top) and PB1-F2 (PR8) (Bottom) were shown. V, vector control. (B) Chemiluminescence intensity for bands specific to PB1-F2 at each time point were captured and measured by a biomolecular imager and plotted after normalized with β-actin. Band intensity at time zero was set as 1. Regression formulation calculated from three sets of experiment is y = –0.103x+0.7205 for PB1-F2 (HK156) and y = –0.0799x+1.0031 for PB1-F2 (PR8). Protein half-life (t1/2) for each PB1-F2 was as indicated.
