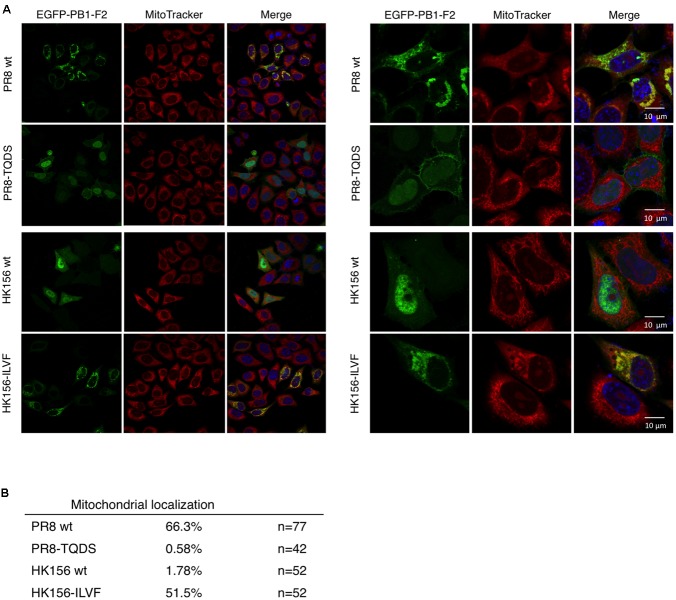
FIGURE 4.
Cellular localization by immunofluorescence confocal microscopy. (A) Plasmids expressing EGFP-tagged PB1-F2 of HK156 and PR8, as well as HK156-ILVF and PR8-TQDS, two swapping mutants, were transfected into HeLa cells. Cells were stained with DAPI (blue) for nuclei and MitoTracker Orange (red) for mitochondria. EGFP signal indicates location of PB1-F2 protein (green). Yellow color indicates merge of red and green signals. Images were captured using Objective Plan-Apochromat 1.4 Oil DIC M27 with power of 63× (Left) or 100× (Right) with Zeiss LSM700. (B) Mitochondrial localization of denoted PB1-F2 was calculated as the percentage of signals of EGFP/MitoTracker. n, number of cells observed from 10 randomly selected fields.

