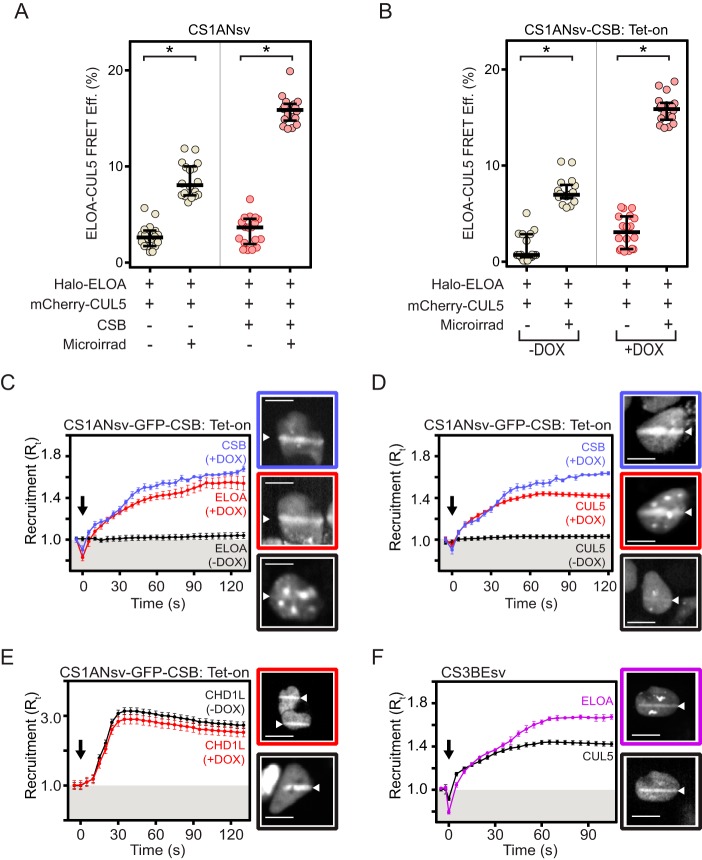
Figure 2.
CSB-dependent recruitment of Elongin A and CUL5 to localized DNA damage. A and B, AP-FRET efficiency (FRET Eff.) in CS1ANsv cells (A) or CS1ANsv-CSB Tet-on cells (B) transiently expressing the indicated proteins and subjected or not to laser microirradiation (Microirrad) as indicated. Graphs show AP-FRET values from individual cells with median and interquartile ranges; n = 18 cells (6 cells from each of 3 independent experiments). *, p < 10−4. Halo-ELOA, Halo-tagged Elongin A. C and D, recruitment of GFP-CSB and either Halo-Elongin A (C) or mCherry-CUL5 (D) in CS1ANsv-GFP-CSB TET-on cells. Induction of CSB expression results in a significant increase in Elongin A and CUL5 recruitment (p < 10−4, based on comparisons of last 10 time points in unpaired t tests). E, recruitment of Halo-CHD1L in CS1ANsv-GFP-CSB Tet-on cells. F, recruitment of Halo-Elongin A and mCherry-CUL5 in CS3BEsv cells. Cells were imaged every second, and intensity values were binned over 5-s intervals. Microirradiation was initiated at time t = 0 (black arrow). Graphs show mean ± S.E., n = 18 cells (6 cells from each of 3 independent experiments). Where indicated, cells were treated with doxycycline (DOX) to induce CSB expression. Included in panels C, D, E, and F are representative images of cells subjected to microirradiation; white triangles indicate regions of microirradiation. Scale bars, 8 μm. For panels C and D, images boxed in blue show GFP-CSB fluorescence in doxycycline-treated cells, and images boxed in red show Halo-Elongin A or mCherry-CUL5 fluorescence, respectively, in the same cells; images boxed in black show either Halo-Elongin A or mCherry-CUL5 fluorescence in cells grown without doxycycline. For panel E, images boxed in red or black show Halo-CHD1L fluorescence in cells grown in the presence or absence of doxycycline, respectively. For panel F, images boxed in purple and black show Halo-Elongin A and mCherry CUL5 fluorescence, respectively, in the same CS3BEsv cell.

