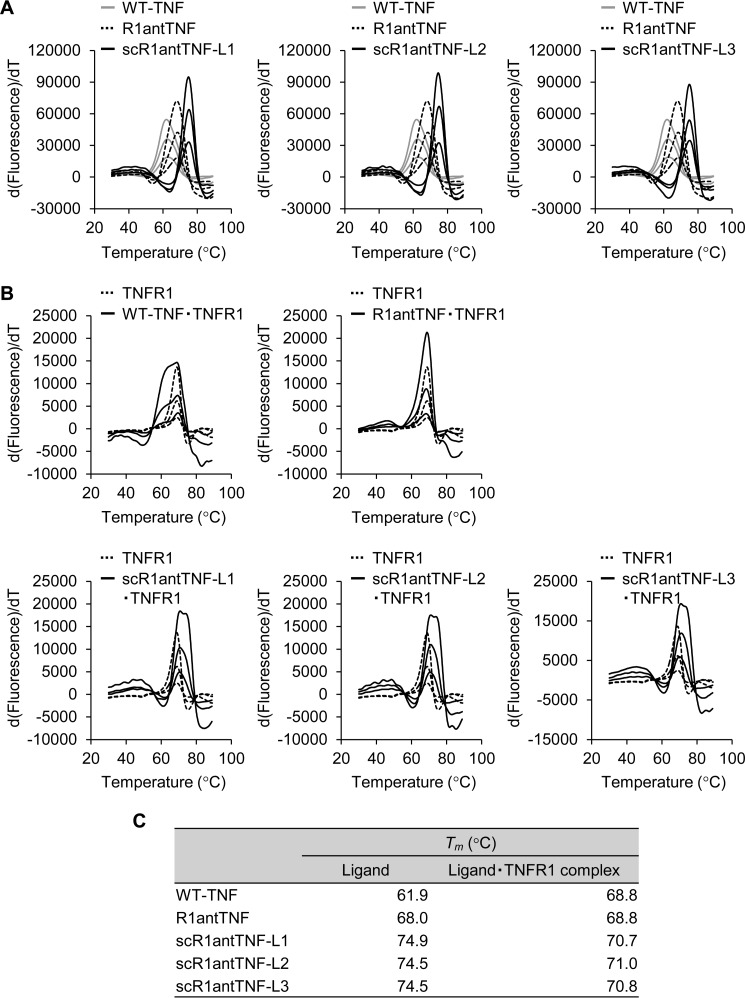
Figure 5.
In vitro thermal stability of scR1antTNFs measured by thermal shift assay. A, thermal stability of WT-TNF (gray line), R1antTNF (dotted line), and scR1antTNFs (black line) was evaluated by TSA. The protein was serially diluted from 700 μg/ml by 2-fold dilution. The inflection point of the peak indicates a protein denaturation temperature (Tm). B, thermal stability of the complex of WT-TNF, R1antTNF, or scR1antTNFs with human TNFR1-Fc was evaluated using TSA of human TNFR1-Fc fusion protein and its complex as shown by the dotted line and black line, respectively. C, Tm values of WT-TNF, R1antTNF, scR1antTNFs, and each complex with TNFR1 are shown.

