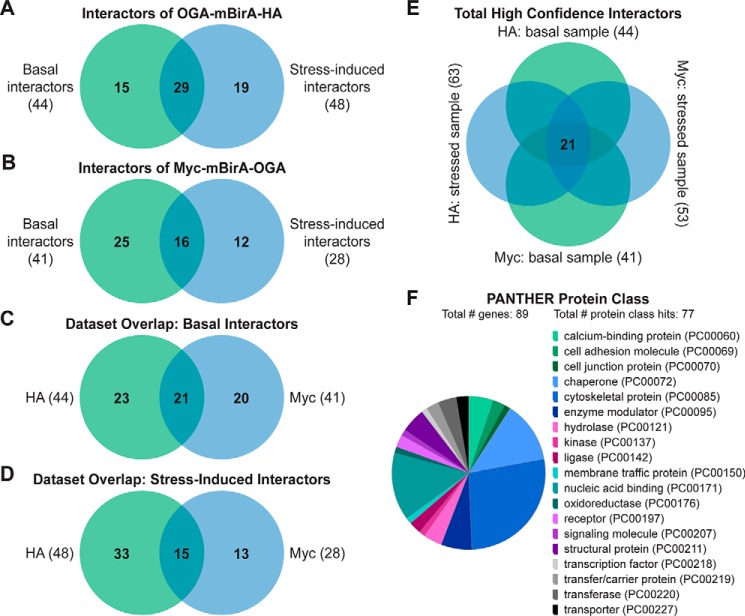
Figure 6.
SILAC-BioID-MS/MS reveals numerous basal and stress-induced OGA-interacting proteins. Venn diagrams illustrate the following: A, basal and stress-induced interactors identified in the OGA-mBirA-HA screen. B, basal and stress-induced interactors identified in the Myc-mBirA-OGA screen. C, basal interactors identified in the HA and Myc datasets. D, stress-induced interactors identified in the HA and Myc datasets. E, interactors identified above background in the basal and stressed samples (regardless of fold change upon stress) in the HA and Myc datasets. F, PANTHER gene list analysis indicating the protein classes represented in the OGA interactome.

