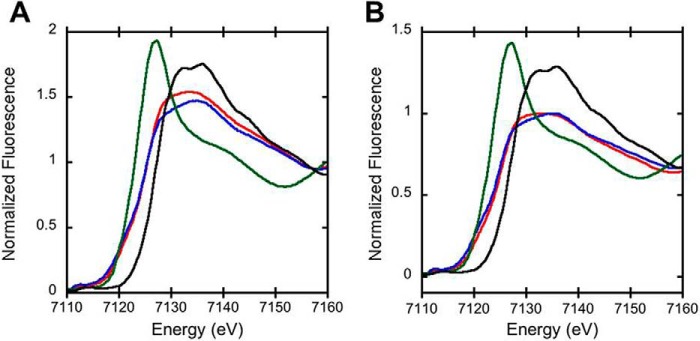
Figure 12.
Normalized iron XANES spectra of FeIII-Ngb. A, normalized iron XANES of wild-type neuroglobin with (blue) and without (red) sulfide treatment. B, normalized iron XANES of H64A neuroglobin with (blue) and without (red) sulfide treatment. In both panels, the XANES spectra of neuroglobin are compared with the FeIISO4 (green) and FeIIISO4 (black) standards.

