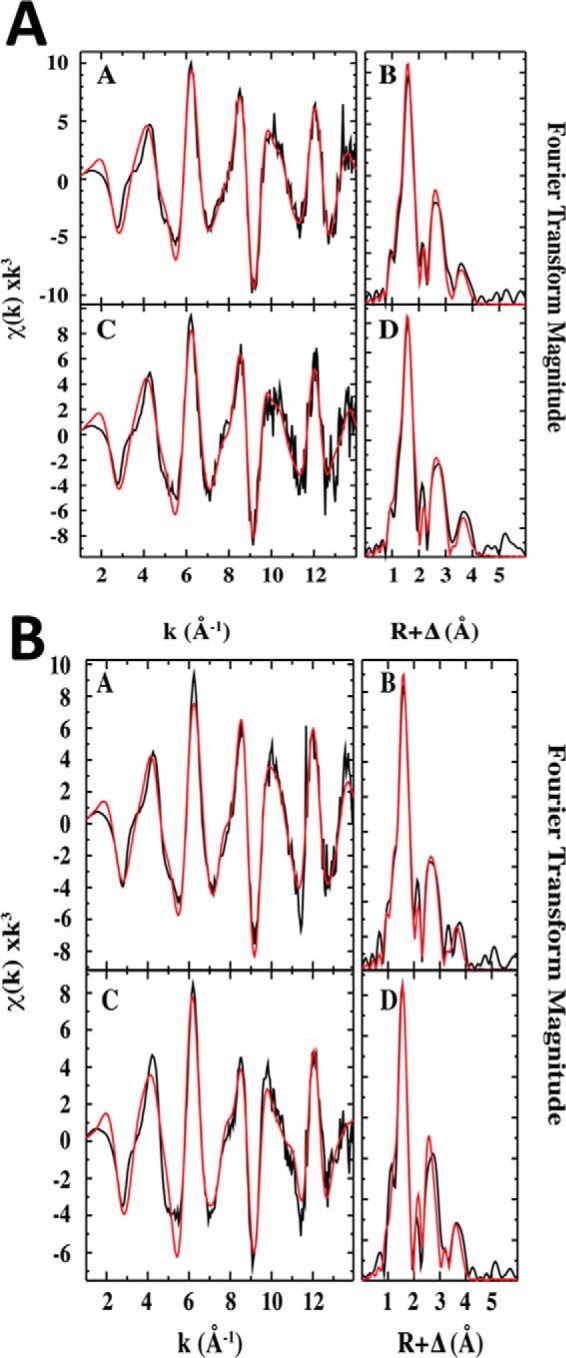
Figure 13.

Comparison of iron EXAFS and Fourier transforms of the EXAFS data for wild-type and H64A neuroglobin. A, raw k3-weighted EXAFS data (a) and phase-shifted Fourier transforms of the EXAFS data (b) for wild-type FeIII-Ngb are shown. EXAFS and Fourier transforms for FeIII-Ngb + sulfide are shown in c and d, respectively. B, comparison of iron EXAFS and Fourier transforms of the EXAFS data for H64A neuroglobin. Raw k3-weighted EXAFS data (a) and phase-shifted Fourier transforms of the EXAFS data (b) for H64A FeIII-Ngb are shown. EXAFS and Fourier transforms for H64A FeIII-Ngb + H2S are shown in c and d, respectively.
