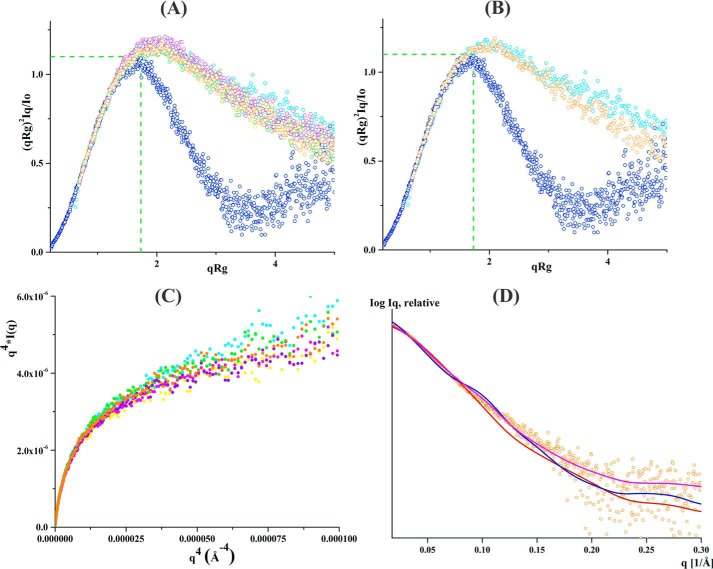
Figure 3.
SAXS data analysis of linker mutants without NADH. A, normalized Kratky plot of lysozyme (blue) shows the bell-shaped profile. The bell-shapes profile vanishes for the EcAhpF(E200A) (yellow), EcAhpF(K201A) (magenta), EcAhpF(R202A) (green), EcAhpF(K201A/R202A) (violet), EcAhpF(E200A/K201A/R202A) (orange), and WT EcAhpF (cyan). B, normalized Kratky plots of EcAhpF(E200A/K201A/R202A) (orange) show a slightly altered profile compared with WT EcAhpF (cyan). C, the absence of plateau at low q angles of the Porod-Debye plots for EcAhpF(E200A) (yellow), EcAhpF(K201A) (magenta), EcAhpF(R202A) (green), EcAhpF(K201A/R202A) (violet), EcAhpF(E200A/K201A/R202A) (orange), and WT EcAhpF (cyan) supports the presence of flexibility. D, the fits between the experimental scattering data of EcAhpF(E200A/K201A/R202A) (○) and the theoretical scattering pattern (—) calculated using the dimers of compact (red) and extended (blue) crystal conformations. The mixture of both conformations (magenta) fits better to the experimental data.

