Figure 1.
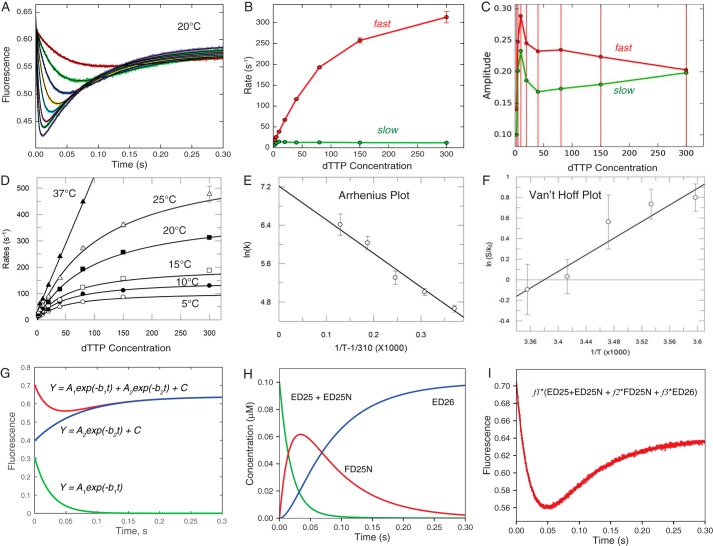
Conventional fitting of temperature dependence of dTTP binding and incorporation by MDCC-labeled WT_HIVRT. We examined the nucleotide concentration dependence of fluorescence signals arising from changes in the structure of the enzyme-DNA complex from open to closed (high to low fluorescence) as described previously (4) and summarized under “Experimental procedures.” The experiments were performed at 5, 10, 15, 20, 25, and 37 °C. The raw data are shown in Fig. 2. A, transients at 20 °C were fit to a double exponential function (Equation 1) by nonlinear regression; the thin black line shows the fitted curve. B, concentration (μm) dependence of the rates of the fast and slow phases derived from fitting data in A with error bars showing the standard errors. C, concentration (μm) dependence of the absolute amplitudes of the fast and slow phases; note the amplitude of the fast phase is positive, and that for the slow phase is negative according to Equation 1, but here we plot the absolute value of the amplitudes. Error bars show the standard errors. D, the concentration dependence of the fast decrease of fluorescence (corresponding to conformational closing) was fit to hyperbolic function (Equation 2) to obtain the maximum rate of the conformational change (k2) and the Kd for ground state binding at each temperature. E, the temperature dependence of k2 was analyzed by Arrhenius plot to estimate a maximum rate for k2 of 1360 ± 300 s−1 at 37 °C, as well as the activation enthalpy of 58 ± 6 kJ/mol. Note here that the x axis is 1/T − 1/310, so that extrapolation to zero gives the rate at 37 °C. Extrapolation to 1/T = 0 leads to huge errors. F, analysis of the temperature dependence of the equilibrium constant for nucleotide binding (S/Kd), where [S] = 100 μm (physiological concentration) on a Van't Hoff plot to give an extrapolated Kd = 186 μm at 37 °C and ΔH = −33.6 kJ/mol. G, fitting of the data at 20 °C at 10 μm dTTP to a double exponential function is shown along with the separate terms for the fast and slow phases according to Equation 1 (A1 = 0.308, b1 = 40.5, A2 = 0.242; b2 = 14.2, C = 0.639); amplitudes are in fluorescence units, and rates are in s−1. H, time dependence of individual species (20 °C and 10 μm dTTP) contributes to the observed fluorescence change derived during global fitting. I, the observed signal at 20 °C at 10 μm dTTP was fit using three scaling factors, here represented by f1, f2, and f3 for each of the three fluorescence states (f1 = 7.05, f2 = 0.684, and f3 = 0.908) from the time dependence of individual species.

