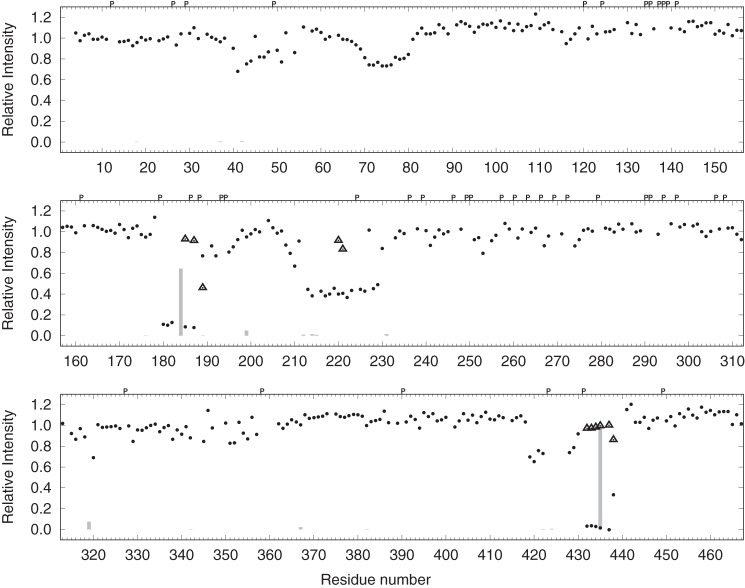
Figure 2.
Phosphorylation of MAP2c. The dots represent the ratio Uu/Up, where Uu and Up are peak intensities of unphosphorylated residues in the unphosphorylated and phosphorylated MAP2c samples, respectively. Triangles represent the ratio Pp/(Up + Pp), where Pp are peak intensities of phosphorylated residues in the phosphorylated MAP2c sample. The bars represent the sum of areas of peptide peaks containing the given phosphorylated residue in mass spectra (relative to the sum of areas of peptides peaks containing Ser-435). Letter P (above the plot), indicates proline residues.

