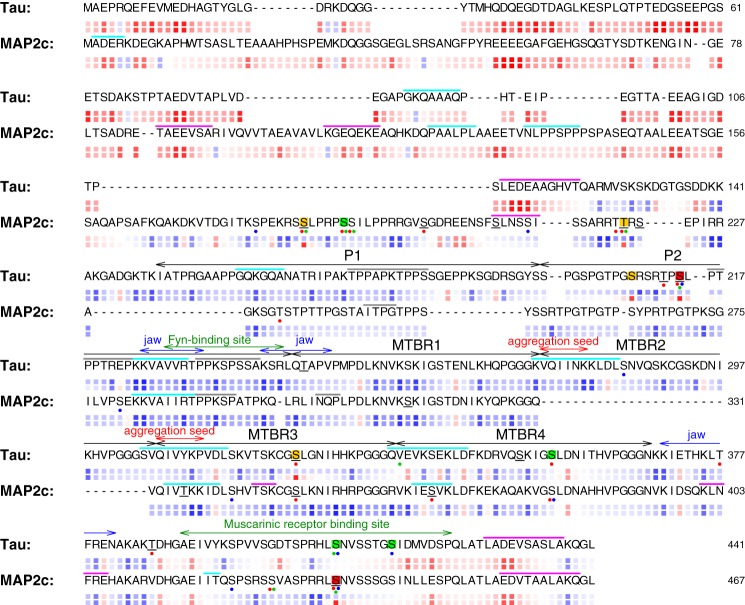
Figure 3.
Comparison of sequences, phosphorylation sites, and electrostatic properties of Tau and MAP2c. Experimentally determined phosphorylation sites are indicated by background colors: red, class I; orange, class II; green, class III (according to the classification used by Laudrieu et al. (43)). The predicted phosphorylation sites are indicated by dots below the sequences: red, prediction by Scansite3; green, prediction by GPS3; blue, prediction by Kinasephos2. Residues predicted by 1433pred (48) to interact with 14-3-3ζ are underlined. Regions with a propensity to form helical, β-strand, and polyproline II structures according to Mukrasch et al. (38) and Nováček et al. (30) are indicated by magenta, cyan, and gray bars above the sequences, respectively. The relative electrostatic potential is shown as color-coded boxes below the sequences for unphosphorylated (upper row) and phosphorylated (lower row) form of each protein. The potential is approximated by ΣjCQi/(d0 + d1|ni − nj|), where Qi and nj are the charge and sequential number of the i-th residue, C is a constant including the electric permittivity, and dk are distance constants. The ratio d1/d0 was set to 2.0, and the colors were chosen so that red and blue correspond to the highest negative and positive potential, respectively, which makes the color code independent of C/d0. Gaps in the sequences were inserted manually to optimize the alignment of regions with similar trends to form transient secondary structures. The annotation of functionally important regions of Tau, defined by the double-headed arrows above the sequences, was taken from the literature (50, 38, 9).

