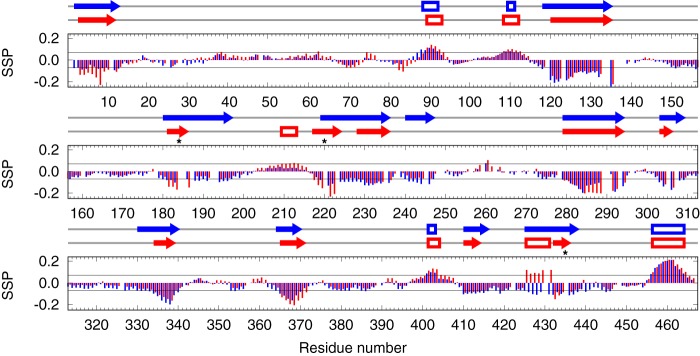
Figure 5.
Effects of phosphorylation on the secondary structure propensity of unphosphorylated MAP2c (blue) and phosphorylated MAP2c (red). The symbols above the graphs indicate continuous regions of unphosphorylated (blue) and phosphorylated (red) with the propensity to form helical (empty boxes) or extended (arrows) structures (see “Experimental procedures” for details). Asterisks indicate the major PKA phosphorylation sites.

